 Back
BackMotion in One Dimension: Study Notes (Chapter 2, College Physics)
Study Guide - Smart Notes
 Tailored notes based on your materials, expanded with key definitions, examples, and context.
Motion in One Dimension
Introduction to Linear Motion
One-dimensional motion, or motion along a straight line, is a foundational concept in physics. This chapter focuses on describing, analyzing, and predicting the motion of objects moving in a straight line, using concepts such as position, velocity, and acceleration.
Describing Motion
Position and Coordinate Systems
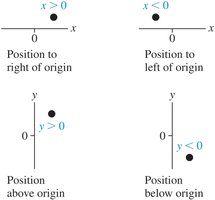
To analyze motion, we define an object's position relative to a chosen origin and coordinate axis. For horizontal motion, the x-axis is used (positive to the right); for vertical motion, the y-axis is used (positive upward).
Position (x or y): The location of an object relative to the origin.
Displacement (Δx or Δy): The change in position, calculated as final position minus initial position.
Motion Diagrams
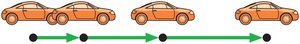
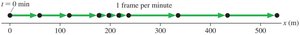
Motion diagrams represent an object's position at successive times, helping visualize how position changes over time.
Equally spaced dots indicate constant velocity.
Increasing or decreasing spacing indicates acceleration or deceleration.
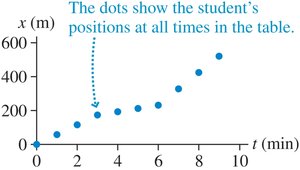
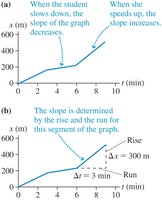
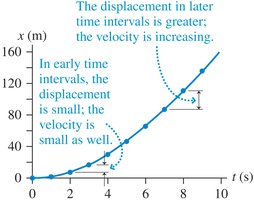
Position vs. Time Graphs
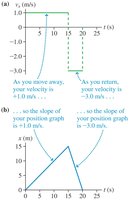
Graphs of position versus time provide a visual representation of motion. The slope of the graph at any point gives the object's velocity at that instant.
Slope = Velocity: Steeper slopes mean higher speeds.
Positive slope: Motion in the positive direction; Negative slope: Motion in the negative direction.
Velocity
Velocity is the rate of change of position with respect to time. It is a vector quantity, meaning it has both magnitude and direction.
Average velocity:
Instantaneous velocity: The velocity at a specific instant, given by the slope of the tangent to the position-time graph at that point.
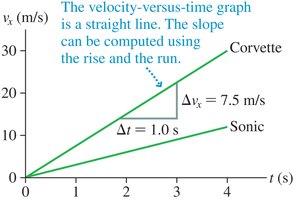
Velocity vs. Time Graphs
Velocity-time graphs show how velocity changes over time. The area under the curve represents displacement.
Constant velocity: Horizontal line.
Changing velocity: Sloped line (indicates acceleration).
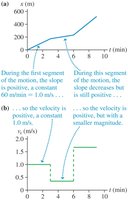
From Velocity to Position
The position-time graph can be deduced from the velocity-time graph. The sign of velocity indicates the direction of motion, and the area under the velocity-time graph gives the displacement.
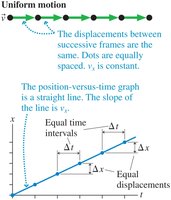
Uniform Motion
Definition and Characteristics
Uniform motion is straight-line motion with constant velocity. Equal displacements occur in equal time intervals, and the position-time graph is a straight line.
Equation:
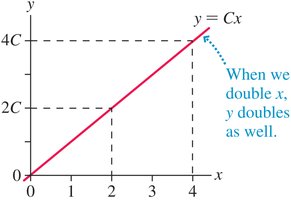
Proportional Relationships
In uniform motion, displacement is proportional to time. If you double the time, the displacement doubles.
General proportionality:
Instantaneous Velocity
Definition and Calculation
Instantaneous velocity is the velocity at a specific instant. It is found by calculating the slope of the tangent to the position-time curve at that point.
Mathematical definition:
Acceleration
Definition and Units
Acceleration is the rate of change of velocity with respect to time. It is a vector quantity and can be positive or negative depending on the direction of velocity change.
Average acceleration:
SI unit: meters per second squared (m/s2)
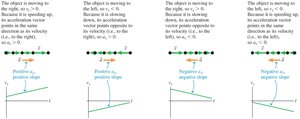
Sign of Acceleration
The sign of acceleration depends on both the direction of motion and whether the object is speeding up or slowing down.
If velocity and acceleration have the same sign, the object speeds up.
If velocity and acceleration have opposite signs, the object slows down.
Motion with Constant Acceleration
Kinematic Equations
For motion with constant acceleration, the following equations apply (for motion along the x-axis):
Quadratic Relationships
When position depends on the square of time, the relationship is quadratic. The position-time graph is a parabola.
General quadratic:
Free Fall
Definition and Properties
Free fall is the motion of an object under the influence of gravity alone, with no other forces acting. All objects in free fall near Earth's surface experience the same acceleration, regardless of mass.
Free-fall acceleration: (downward)
Use kinematic equations with for upward motion and for downward motion.
Problem-Solving Strategies
Four-Step Approach
Strategize: Identify the type of problem and relevant principles.
Prepare: Draw diagrams, define variables, and list knowns and unknowns.
Solve: Apply appropriate equations and perform calculations.
Assess: Check units, significant figures, and physical reasonableness of the answer.
Pictorial and Graphical Representations
Drawing motion diagrams, pictorial representations, and graphs helps clarify the problem and organize information for solution.
Summary Table: Key Equations for One-Dimensional Motion
Type of Motion | Equation | Description |
|---|---|---|
Uniform Motion | Constant velocity | |
Constant Acceleration | Velocity after time t | |
Constant Acceleration | Position after time t | |
Constant Acceleration | Velocity as a function of position | |
Free Fall | Use above with | Vertical motion under gravity |
Applications and Examples
Analyzing the motion of vehicles, athletes, and falling objects using the above concepts and equations.
Solving problems by interpreting graphs and diagrams, and applying ratio reasoning for proportional and quadratic relationships.
