 Back
BackPhase Changes and Phase Diagrams in Properties of Matter
Study Guide - Smart Notes
 Tailored notes based on your materials, expanded with key definitions, examples, and context.
Phase Changes
Introduction to Phase Changes
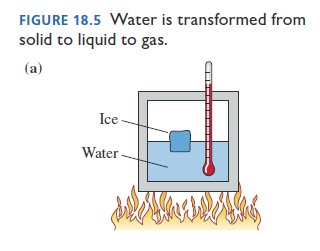
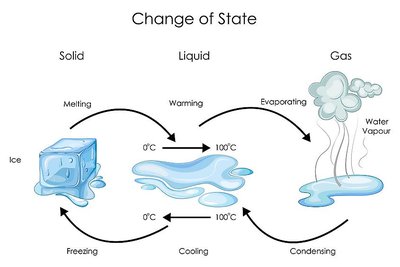
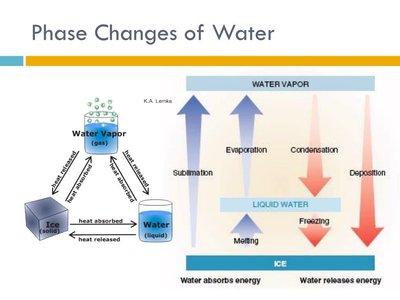
Phase changes refer to the transformation of a substance between solid, liquid, and gas states due to the addition or removal of thermal energy. Water is a common example, exhibiting these changes at specific temperatures under standard atmospheric pressure.
Solid to Liquid: Melting occurs when a solid absorbs enough energy to become a liquid.
Liquid to Gas: Boiling or evaporation occurs when a liquid absorbs enough energy to become a gas.
Liquid to Solid: Freezing occurs when a liquid loses energy and becomes a solid.
Gas to Liquid: Condensation occurs when a gas loses energy and becomes a liquid.
Solid to Gas: Sublimation is the direct transition from solid to gas without passing through the liquid phase.
Melting and Freezing Points
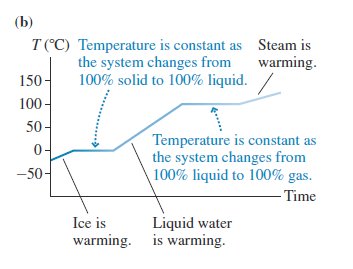
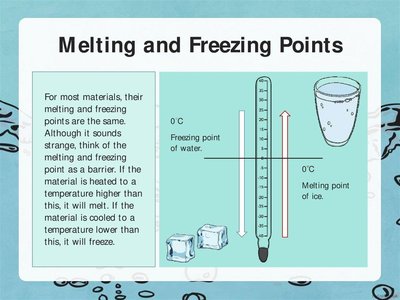
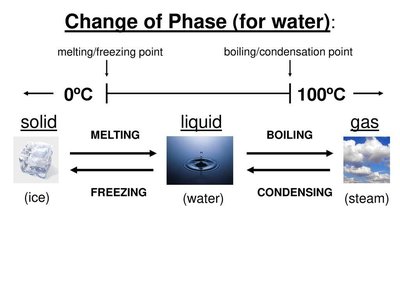
The melting point is the temperature at which a solid becomes a liquid, and the freezing point is the temperature at which a liquid becomes a solid. For pure substances, these points are typically the same. For water at 1 atm pressure, both occur at 0°C.
At the melting/freezing point, both solid and liquid phases can coexist in equilibrium.
Thermal energy added or removed at this point does not change the temperature but changes the phase.
Phase Equilibrium
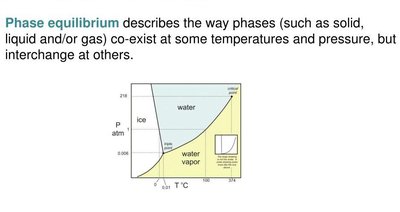
At the melting or boiling point, a system can exist in phase equilibrium, where two phases coexist. For example, at 0°C and 1 atm, ice and liquid water can coexist in equilibrium.
Any amount of solid can coexist with any amount of liquid at the melting point.
Similarly, at the boiling point, liquid and gas can coexist.
Condensation and Boiling Points
The boiling point is the temperature at which a liquid becomes a gas, and the condensation point is the temperature at which a gas becomes a liquid. For water at 1 atm, this occurs at 100°C.
Boiling and condensation are also phase changes that occur at constant temperature for a pure substance at a given pressure.
Energy and Phase Changes
During a phase change, the temperature of the system remains constant while energy is absorbed or released. This energy is called latent heat.
Latent heat of fusion (Lf): Energy required to change a unit mass from solid to liquid at constant temperature.
Latent heat of vaporization (Lv): Energy required to change a unit mass from liquid to gas at constant temperature.
Equations:
For melting/freezing:
For boiling/condensation:
Phase Diagrams
Understanding Phase Diagrams
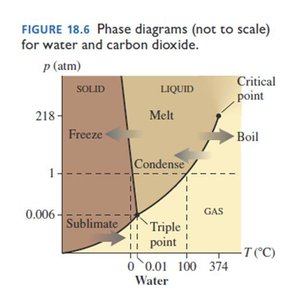
A phase diagram is a graphical representation showing the state of a substance (solid, liquid, or gas) as a function of temperature and pressure. The diagram contains regions for each phase and lines (boundaries) where phase transitions occur.
Each region corresponds to a single phase.
Boundary lines indicate conditions where two phases coexist in equilibrium.
The intersection of all three boundaries is the triple point.
Key Features of Water's Phase Diagram
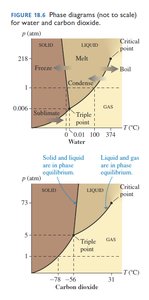
At 1 atm, water melts at 0°C and boils at 100°C.
These temperatures change with pressure; for example, increasing pressure raises the boiling point.
The solid-liquid boundary for water slopes to the left, indicating that ice melts under pressure (unusual compared to most substances).
Pressure Effects and Applications
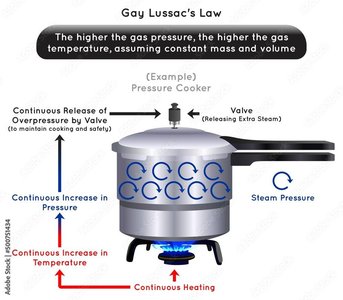
Increasing the pressure above 1 atm (e.g., in a pressure cooker) raises the boiling point of water, allowing food to cook at higher temperatures and thus more quickly.
Pressure cookers utilize this principle for efficient cooking.
Sublimation and Carbon Dioxide
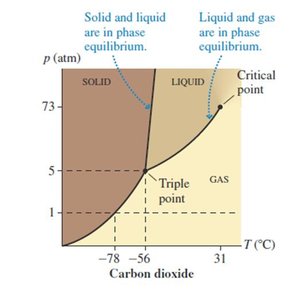
Sublimation is the direct transition from solid to gas. For carbon dioxide (dry ice), sublimation occurs at -78°C at 1 atm, as shown in its phase diagram. Liquid CO2 only exists at pressures above 5 atm and temperatures above -56°C.
Dry ice is commonly used for cooling because it sublimates at atmospheric pressure.
CO2 fire extinguishers contain liquid CO2 under high pressure.
Critical Point and Triple Point
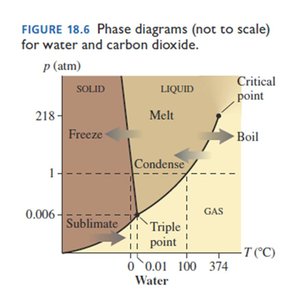
The critical point is the end of the liquid-gas boundary; above this temperature and pressure, there is no distinction between liquid and gas. The triple point is the unique set of conditions where all three phases coexist in equilibrium.
For water, the triple point is at 0.01°C and 0.006 atm.
The triple point is used to define the Kelvin temperature scale.
Kelvin Temperature Scale
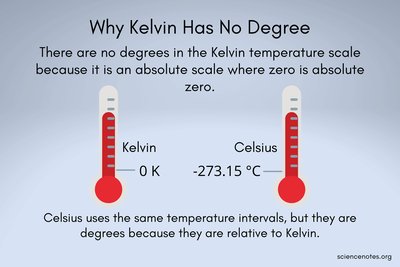
The Kelvin scale is an absolute temperature scale, starting at absolute zero (0 K), with the triple point of water defined as 273.16 K. The Celsius and Kelvin scales are related by:
Absolute zero on the Celsius scale is -273.15°C.
Summary Table: Phase Changes of Water
Phase Change | Process Name | Temperature at 1 atm | Direction |
|---|---|---|---|
Solid to Liquid | Melting | 0°C | Absorbs energy |
Liquid to Solid | Freezing | 0°C | Releases energy |
Liquid to Gas | Boiling/Evaporation | 100°C | Absorbs energy |
Gas to Liquid | Condensation | 100°C | Releases energy |
Solid to Gas | Sublimation | Below 0°C (for water, not common at 1 atm) | Absorbs energy |
Gas to Solid | Deposition | Below 0°C (for water, not common at 1 atm) | Releases energy |
