 Back
BackComprehensive Precalculus Exam 2 Review Guidance
Study Guide - Smart Notes
 Tailored notes based on your materials, expanded with key definitions, examples, and context.
Q1. Find the average rate of change of from to .
Background
Topic: Average Rate of Change
This question tests your understanding of how to calculate the average rate of change for a function over a specified interval. This is a foundational concept in precalculus and calculus, relating to slopes and secant lines.
Key formula:
The average rate of change of from to is:
Step-by-Step Guidance
Identify the interval: to .
Calculate and using the given function .
Plug these values into the formula: .
Simplify the numerator and denominator, but stop before the final calculation.
Try solving on your own before revealing the answer!
Final Answer: 2
,
The average rate of change is -4, indicating the function decreases over this interval.
Q2. Find an equation of a secant line containing and .
Background
Topic: Secant Lines
This question tests your ability to write the equation of a line passing through two points on a function, which is called a secant line. This is closely related to the average rate of change.
Key formula:
The equation of a line through points and is:
, where
Step-by-Step Guidance
Identify the two points: and .
Calculate and using the function .
Find the slope using .
Write the equation of the line using the point-slope form, but stop before plugging in all values.
Try solving on your own before revealing the answer!
Final Answer:
The slope is -4, and using the point , the equation is , which simplifies to .
Q3. Application of Average Rate of Change: Use the graph of to answer the following questions.
Background
Topic: Average Rate of Change in Real-World Context
This question asks you to interpret a graph and apply the average rate of change formula to real-world data, specifically the number of women earning a Ph.D. over time.
Key formula:
Step-by-Step Guidance
Read values from the graph for the years specified (e.g., 1980, 2000).
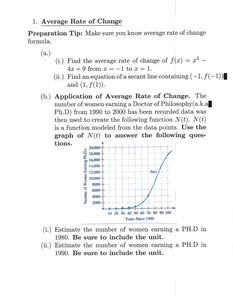
Apply the average rate of change formula for the interval (e.g., 1980 to 2000).
Interpret the units (e.g., women per year) and include them in your answer.
Stop before calculating the final value.
Try solving on your own before revealing the answer!
Final Answer: 200 women per year
Using the graph, divided by gives the average rate of change.
Q4. Section 2.4: Piecewise Functions/Library Functions
Background
Topic: Piecewise Functions
This section tests your ability to evaluate, sketch, and analyze piecewise functions, including determining domain and continuity.
Key terms:
Piecewise function: A function defined by different expressions for different intervals of the domain.
Domain: The set of input values for which the function is defined.
Continuity: Whether the function has any breaks, jumps, or holes in its graph.
Step-by-Step Guidance
For each interval, write the expression that defines the function.
Evaluate the function at specified points by plugging in values.
Sketch the function by plotting points and connecting them according to the rules for each interval.
Analyze the domain and check for continuity by examining endpoints and overlaps.
Try solving on your own before revealing the answer!
Final Answer: Domain is , not continuous
The function is defined for , but there is a jump at .
Q5. Section 2.5: Transformations of Functions
Background
Topic: Function Transformations
This section tests your understanding of how parent functions are transformed by shifts, reflections, and stretches/compressions.
Key terms:
Parent function: The basic form of a function (e.g., ).
Transformation: Operations that change the position or shape of the graph (e.g., shifts, reflections).
Step-by-Step Guidance
Apply each transformation in the specified order (reflection, shift, etc.).
Track how the graph changes after each step.
Identify the new coordinates of key points after transformations.
Describe the overall effect in words, but stop before the final description.
Try solving on your own before revealing the answer!
Final Answer:
The function is reflected, shifted left 2 units, and down 3 units.
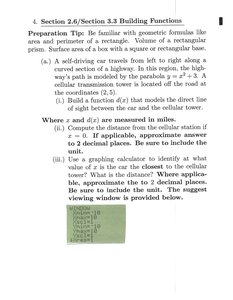
Q6. Section 2.6/Section 3.3: Building Functions
Background
Topic: Modeling with Functions
This section tests your ability to build and analyze functions based on geometric and real-world scenarios, such as distance and area.
Key terms:
Distance formula:
Volume and surface area formulas for geometric shapes.
Step-by-Step Guidance
Write the function based on the scenario (e.g., distance from a point).
Plug in values as needed to evaluate the function.
Use a calculator or graph to approximate values, but stop before the final calculation.
Try solving on your own before revealing the answer!
Final Answer: Distance is approximately 0.55 miles
Using the distance formula and the calculator window, you can estimate the value.
Q7. Section 4.1: Analyzing Polynomial Functions
Background
Topic: Polynomial Functions
This section tests your ability to analyze polynomial graphs, including zeros, multiplicity, turning points, and degree.
Key terms:
Zero: A value of where .
Multiplicity: The number of times a zero occurs.
Turning point: A point where the graph changes direction.
Degree: The highest power of in the polynomial.
Step-by-Step Guidance
Identify zeros from the graph.
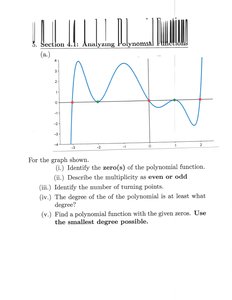
Describe multiplicity as even or odd based on whether the graph touches or crosses the x-axis.
Count the number of turning points.
Estimate the degree based on turning points and zeros, but stop before the final answer.
Try solving on your own before revealing the answer!
Final Answer: Degree is 7, 6 turning points
The graph has 7 zeros and 6 turning points, so the degree is at least 7.
Q8. Section 4.5: Analyzing Rational Functions
Background
Topic: Rational Functions
This section tests your ability to analyze rational functions, including domain, intercepts, asymptotes, and holes.
Key terms:
Domain: Values for which the function is defined.
Intercepts: Points where the graph crosses axes.
Asymptotes: Lines the graph approaches but never touches.
Holes: Points where the function is undefined due to cancellation.
Step-by-Step Guidance
Find the domain by identifying values that make the denominator zero.
Find zeros by setting the numerator equal to zero.
Find intercepts by plugging in or .
Identify vertical and horizontal asymptotes, but stop before the final answer.
Try solving on your own before revealing the answer!
Final Answer: Domain is , vertical asymptote at
The denominator is zero at , so the function is undefined there.
Q9. Section 5.1: Composition/Decomposition of Functions
Background
Topic: Function Composition and Decomposition
This section tests your ability to compose and decompose functions, a key skill for understanding more complex functions.
Key formula:
means plug into wherever appears.
Step-by-Step Guidance
Write and as given.
Substitute into to form .
Simplify the resulting expression, but stop before the final simplification.
Try solving on your own before revealing the answer!
Final Answer:
Substituting into gives .
Q10. Section 5.2: Inverse Functions/Range of a Function
Background
Topic: Inverse Functions and Range
This section tests your ability to find the inverse of a function and determine its domain and range.
Key formula:
To find the inverse, solve for in terms of , then swap $x$ and $y$.
Step-by-Step Guidance
Write the function .
Replace with and solve for .
Swap and to get the inverse function.
Determine the domain and range, but stop before the final answer.
Try solving on your own before revealing the answer!
Final Answer: , domain
The inverse is found by solving for .
