 Back
BackExponential and Logarithmic Functions: Modeling Growth and Decay
Study Guide - Smart Notes
 Tailored notes based on your materials, expanded with key definitions, examples, and context.
Exponential and Logarithmic Functions
Constant Percentage Rate and Exponential Functions
Exponential functions are used to model situations where a quantity changes at a constant percentage rate over time. This is common in population growth, finance, and natural processes.
Constant Percentage Rate: If a population changes at a constant percentage rate r (expressed as a decimal), the population follows an exponential pattern.
Exponential Population Model: The general form is: where is the initial population, is the rate of change, and is time in years.
Example: If the initial value is 10 and the rate is 5% per year, the function is:
Exponential Growth and Decay Models
Exponential growth and decay describe processes where the rate of change is proportional to the current amount. These models are widely used in biology, chemistry, business, and social sciences.
Exponential Growth: Occurs when the quantity increases over time, such as population or bacteria growth.
Exponential Decay: Occurs when the quantity decreases over time, such as radioactive decay.
General Model: where is the initial amount, is the growth/decay factor, and is time.
Example: Modeling Bacteria Growth
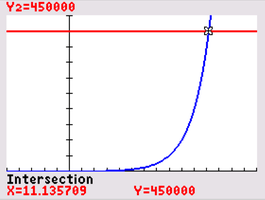
Suppose a culture of 200 bacteria doubles every hour. To predict when the population will reach 450,000:
Model:
Find: Solve for .
Graphical Solution: The intersection point on the graph shows hours.
Example: Modeling Radioactive Decay
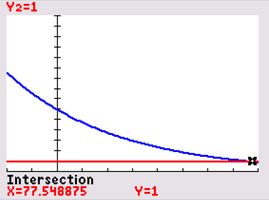
Suppose the half-life of a substance is 30 days and the initial mass is 6 g. To find when 1 g remains:
Model:
Find: Solve for .
Graphical Solution: The intersection point on the graph shows days.
Choosing and Validating a Growth Model for Data
Exponential regression is used to fit an exponential model to real-world data, such as population statistics. This involves entering data, setting graphing parameters, plotting, and finding the best-fit equation.
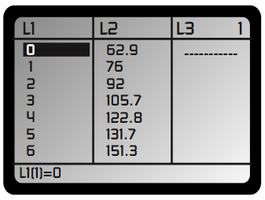
Step 1: Enter Data Input years and population values into a calculator or software.
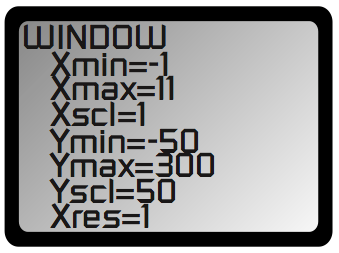
Step 2: Set Window Adjust graphing window to fit the data range.
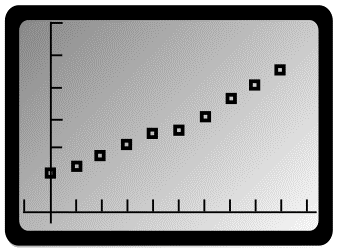
Step 3: Make Scatter Plot Visualize the data points.
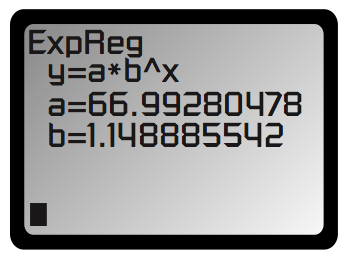
Step 4: Perform Exponential Regression Use regression tools to find the best-fit exponential equation.
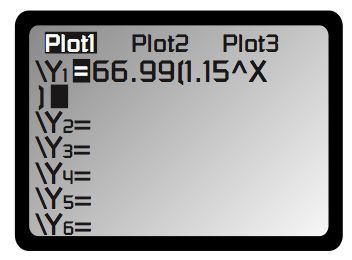
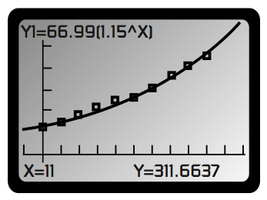
Step 5: Graph Regression Equation Plot the regression equation alongside the data.
Step 6: Predict Values Use the model to estimate future values, such as the population in the year 2000.
Maximum Sustainable Population and Logistic Growth
While exponential growth is unrestricted, real-world populations often approach a maximum sustainable limit. Logistic growth models describe this behavior, where growth slows as the population nears its maximum.
Logistic Growth Model: where is the carrying capacity, and are constants, and is time.
Example: Modeling the spread of a rumor in a school with 1500 students. The logistic function predicts how many students have heard the rumor over time.
Interpretation: The model shows rapid initial growth, then slows as it approaches the maximum population.
Table: Comparison of Exponential and Logistic Growth
Model | Equation | Behavior |
|---|---|---|
Exponential Growth | Unrestricted, rapid increase | |
Logistic Growth | Growth slows as it approaches maximum |
Additional info: Exponential and logistic models are foundational in precalculus for understanding real-world applications of functions, especially in modeling population dynamics, radioactive decay, and data fitting.
