 Back
BackFunctions and Graphs: Core Concepts and Transformations in Precalculus
Study Guide - Smart Notes
 Tailored notes based on your materials, expanded with key definitions, examples, and context.
Functions and Graphs
Relations, Functions, Domain, and Range
Understanding the distinction between relations and functions is foundational in precalculus. A relation is any set of ordered pairs, while a function is a relation in which each input (domain value) corresponds to exactly one output (range value).
Domain: The set of all possible input values (x-values) for a function.
Range: The set of all possible output values (y-values) for a function.
Set Notation: Domains and ranges are often expressed in set notation, e.g., {x | x ≥ 0}.
To determine if a relation is a function, check that no input value is paired with more than one output value.
Increasing, Decreasing, and Constant Intervals
The behavior of a function can be described by intervals where it is increasing, decreasing, or constant:
Increasing: A function f(x) is increasing on an interval if, as x increases, f(x) also increases.
Decreasing: A function f(x) is decreasing on an interval if, as x increases, f(x) decreases.
Constant: A function f(x) is constant on an interval if, as x increases, f(x) remains the same.
Even and Odd Functions
Functions can be classified as even, odd, or neither based on their symmetry:
Even Function: f(x) is even if for all x in the domain. Even functions are symmetric about the y-axis.
Odd Function: f(x) is odd if for all x in the domain. Odd functions have rotational symmetry about the origin.
Neither: If a function does not satisfy either condition, it is neither even nor odd.
Piecewise Functions
A piecewise function is defined by different expressions over different intervals of the domain. To evaluate a piecewise function, determine which interval the input belongs to and use the corresponding expression.
Example:
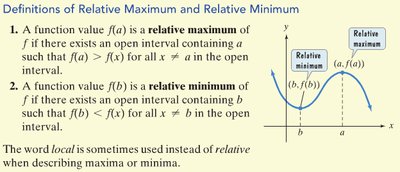
Relative Maximum and Minimum
Relative (or local) maxima and minima are important for understanding the behavior of functions:
Relative Maximum: A function value f(a) is a relative maximum if it is greater than all nearby values.
Relative Minimum: A function value f(b) is a relative minimum if it is less than all nearby values.
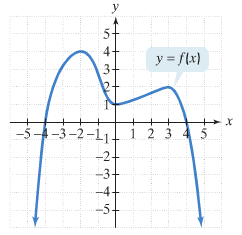
Graphical Analysis of Functions
Graphs provide visual insight into the properties of functions, including intercepts, intervals of increase/decrease, and extrema.
x-intercept: The point(s) where the graph crosses the x-axis (set y = 0).
y-intercept: The point where the graph crosses the y-axis (set x = 0).
Relative Maxima/Minima: Highest/lowest points in a local region of the graph.
Linear Functions and Slope
Slope and Rate of Change
The slope of a line measures its steepness and is calculated as:
Parallel Lines: Have the same slope.
Perpendicular Lines: Have slopes that are negative reciprocals; their product is -1.
Forms of Linear Equations
Standard Form:
Slope-Intercept Form:
Point-Slope Form:
Special cases include horizontal lines (, slope = 0) and vertical lines (, slope undefined).
Finding Intercepts
x-intercept: Set y = 0 and solve for x.
y-intercept: Set x = 0 and solve for y.
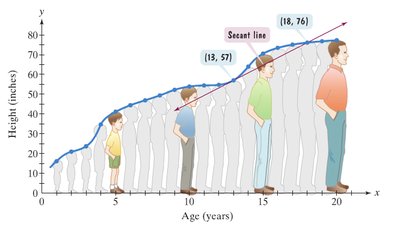
Average Rate of Change
The average rate of change of a function between two points is the slope of the secant line connecting those points:
Difference Quotient
Definition and Application
The difference quotient is a formula used to compute the average rate of change over an interval and is foundational for calculus:
, for
Used to find the slope of the secant line between two points on a function.
Transformations of Functions
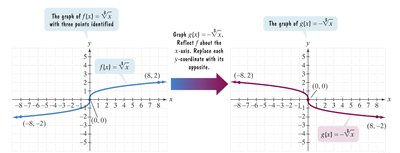
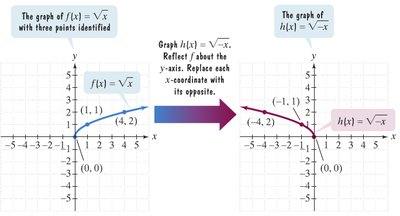
Reflections
Reflection about the x-axis: reflects the graph over the x-axis.
Reflection about the y-axis: reflects the graph over the y-axis.
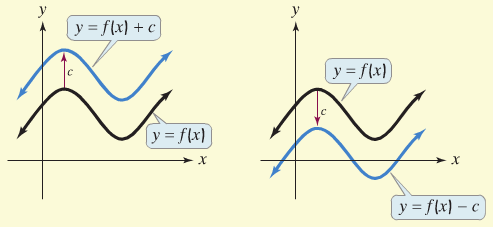
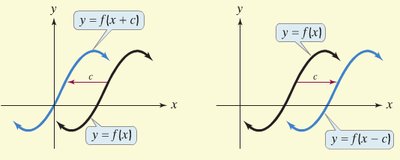
Vertical and Horizontal Shifts
Vertical Shift Up: shifts the graph up by c units.
Vertical Shift Down: shifts the graph down by c units.
Horizontal Shift Left: shifts the graph left by c units.
Horizontal Shift Right: shifts the graph right by c units.
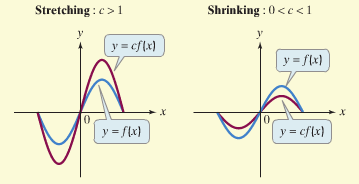
Vertical Stretching and Shrinking
Vertical Stretch: , stretches the graph vertically by a factor of c.
Vertical Shrink: , shrinks the graph vertically by a factor of c.
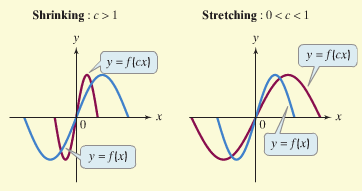
Horizontal Stretching and Shrinking
Horizontal Shrink: , shrinks the graph horizontally by a factor of c.
Horizontal Stretch: , stretches the graph horizontally by a factor of c.
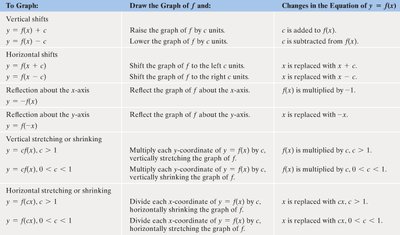
Summary Table of Transformations
The following table summarizes the main types of function transformations and their effects:
To Graph: | Draw the Graph of f and: | Changes in the Equation of y = f(x) |
|---|---|---|
Vertical shifts | Raise/lower the graph by c units | c is added/subtracted to f(x) |
Horizontal shifts | Shift left/right by c units | x is replaced with x + c or x - c |
Reflection about the x-axis | Reflect over x-axis | f(x) is multiplied by -1 |
Reflection about the y-axis | Reflect over y-axis | x is replaced with -x |
Vertical stretching/shrinking | Multiply y-coordinates by c | f(x) is multiplied by c |
Horizontal stretching/shrinking | Divide x-coordinates by c | x is replaced with c x |
Practice and Application
Apply these concepts to analyze, graph, and transform functions. Practice problems may involve identifying intervals of increase/decrease, finding intercepts, classifying functions as even/odd/neither, and describing or sketching transformations.
