 Back
BackFunctions and Graphs: Key Concepts and Transformations in Precalculus
Study Guide - Smart Notes
 Tailored notes based on your materials, expanded with key definitions, examples, and context.
Functions and Graphs
Relations, Functions, Domain, and Range
In precalculus, understanding the distinction between relations and functions is fundamental. A relation is any set of ordered pairs, while a function is a relation in which each input (x-value) corresponds to exactly one output (y-value). The domain of a function is the set of all possible input values, and the range is the set of all possible output values.
Function Test: A relation is a function if no x-value is repeated with different y-values.
Set Notation: Domains and ranges are often written in set notation, e.g., {x | x ≥ 0}.
Example: The relation {(−2, 0), (1, 1), (2, −1), (1, 3)} is not a function because x = 1 is paired with two different y-values.
Increasing, Decreasing, and Constant Intervals
A function can be classified by how its output changes as the input increases:
Increasing: f(x) increases as x increases.
Decreasing: f(x) decreases as x increases.
Constant: f(x) remains unchanged as x increases.
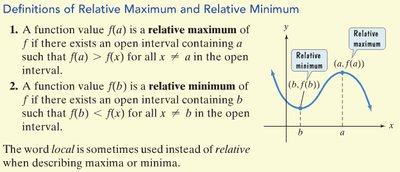
Relative Maximum and Minimum
Relative (or local) maxima and minima are important for analyzing the behavior of functions. A relative maximum is a point where the function value is higher than at nearby points, while a relative minimum is a point where the function value is lower than at nearby points.
Relative Maximum: for all near .
Relative Minimum: for all near .
Even and Odd Functions
Definitions and Properties
Functions can be classified as even, odd, or neither based on their symmetry:
Even Function: for all in the domain. Graph is symmetric about the y-axis.
Odd Function: for all in the domain. Graph has 180° rotational symmetry about the origin.
Neither: If neither condition is satisfied.
Example: is even; is odd.
Piecewise Functions
Definition and Evaluation
A piecewise function is defined by different expressions for different intervals of the domain. To evaluate, determine which interval the input belongs to and use the corresponding expression.
Example:
Evaluation: , ,
Linear Functions and Slope
Slope and Rate of Change
The slope of a line measures its steepness and is calculated as:
Formula:
Parallel Lines: Same slope.
Perpendicular Lines: Slopes are opposite reciprocals;
Forms of Linear Equations
Standard Form:
Slope-Intercept Form:
Point-Slope Form:
Horizontal Line: (slope = 0)
Vertical Line: (slope undefined)
Finding Intercepts
x-intercept: Set and solve for .
y-intercept: Set and solve for .
Average Rate of Change
Definition and Application
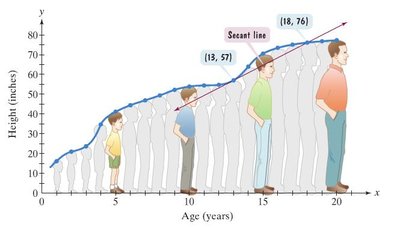
The average rate of change of a function between two points is the slope of the secant line connecting those points. It is calculated as:
Formula:
Example: If a man's height at age 13 is 57 inches and at age 18 is 76 inches, the average rate of change is inches per year.
Difference Quotient
Definition and Calculation
The difference quotient is a formula used to find the average rate of change over an interval and is foundational for calculus:
Formula: , where
Example: For ,
Transformations of Functions
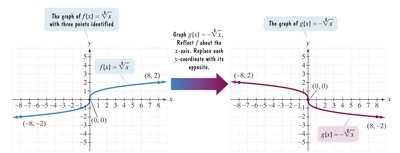
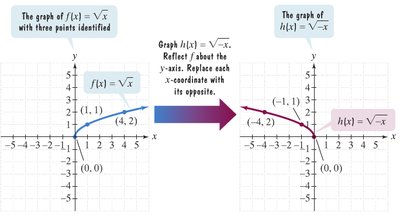
Reflections
Reflections change the orientation of a function's graph:
Reflection about the x-axis:
Reflection about the y-axis:
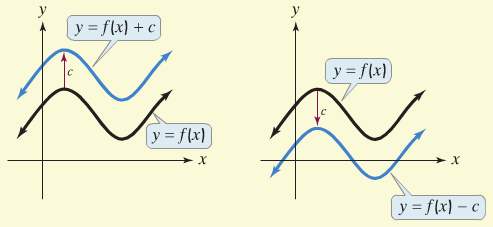
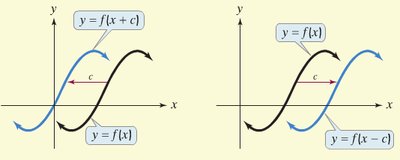
Vertical and Horizontal Shifts
Shifts move the graph without changing its shape:
Vertical Shift Up:
Vertical Shift Down:
Horizontal Shift Left:
Horizontal Shift Right:
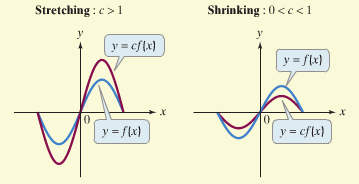
Vertical Stretching and Shrinking
Multiplying a function by a constant changes its vertical scale:
Stretch: ,
Shrink: ,
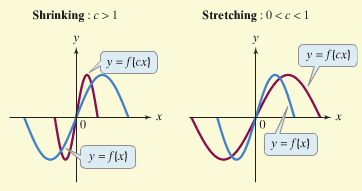
Horizontal Stretching and Shrinking
Multiplying the input by a constant changes the horizontal scale:
Shrink: ,
Stretch: ,
Summary Table of Transformations
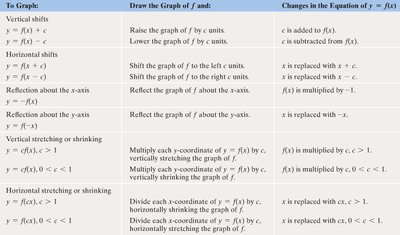
The following table summarizes the main types of function transformations:
To Graph: | Draw the Graph of f and: | Changes in the Equation of y = f(x) |
|---|---|---|
Vertical shifts | Raise/lower the graph by c units | c is added/subtracted to f(x) |
Horizontal shifts | Shift left/right by c units | x is replaced with x + c or x - c |
Reflection about x-axis | Reflect over x-axis | f(x) is multiplied by -1 |
Reflection about y-axis | Reflect over y-axis | x is replaced with -x |
Vertical stretching/shrinking | Multiply y-coordinates by c | f(x) is multiplied by c |
Horizontal stretching/shrinking | Divide x-coordinates by c | x is replaced with cx |
Examples of Function Transformations
Example 1: , Transformation: Shift left by 2, reflect over x-axis, shift down by 8.
Example 2: , Transformation: Shift right by 1, vertical stretch by 2, shift up by 3.
Example 3: , Transformation: Reflect over y-axis, shift right by 3, shift down by 1.
