 Back
BackGraphing Techniques: Transformations of Functions
Study Guide - Smart Notes
 Tailored notes based on your materials, expanded with key definitions, examples, and context.
Section 2.5: Graphing Techniques – Transformations
Introduction
Transformations are fundamental techniques used to modify the graphs of functions. By applying shifts, stretches, compressions, and reflections, we can graph functions that are closely related to basic or "library" functions. Understanding these transformations allows us to predict and construct the graphs of more complex functions efficiently.
Vertical and Horizontal Shifts
Shifting a graph vertically or horizontally changes its position without altering its shape. These shifts are determined by adding or subtracting constants either outside or inside the function.
Vertical Shift: If a constant k is added to the output of a function, the graph shifts up k units. If k is subtracted, the graph shifts down k units.
Horizontal Shift: If a constant h is added to the input variable x inside the function, the graph shifts left h units. If h is subtracted, the graph shifts right h units.
Formulas:
Vertical Shift: (up k units), (down k units)
Horizontal Shift: (right h units), (left h units)
Example: The graph of is the graph of shifted vertically up 2 units.
Example: The graph of is the graph of shifted horizontally right 1 unit.
Additional info: The domain and range of the transformed function may change depending on the shift and the original function's domain and range.
Compressions and Stretches
Compressions and stretches alter the shape of the graph by changing its scale either vertically or horizontally. These transformations are achieved by multiplying the function or its input by a constant.
Vertical Stretch: Multiplying the function by a constant a > 1 stretches the graph vertically by a factor of a.
Vertical Compression: Multiplying the function by a constant 0 < a < 1 compresses the graph vertically by a factor of a.
Horizontal Stretch: Multiplying the input variable x by a constant 0 < a < 1 stretches the graph horizontally by a factor of .
Horizontal Compression: Multiplying the input variable x by a constant a > 1 compresses the graph horizontally by a factor of .
Formulas:
Vertical Stretch/Compression:
Horizontal Stretch/Compression:
Example: The graph of is a vertical stretch by a factor of 3.
Example: The graph of is a horizontal compression by a factor of .
Reflections About the x-Axis and y-Axis
Reflections flip the graph over a specified axis, creating a mirror image. This is achieved by multiplying the function or its input by -1.
Reflection about the x-axis:
Reflection about the y-axis:
Example: The graph of is the reflection of about the x-axis.
Example: The graph of is the reflection of about the y-axis.
Combining Transformations
Multiple transformations can be applied in sequence to a function. The order of operations can affect the final graph, so a consistent approach is recommended:
Horizontal shift
Reflections
Compressions and stretches
Vertical shift
Example: To graph , apply the following steps:
Shift right 3 units
Vertical stretch by 2
Reflect about the x-axis
Shift up 1 unit
Summary Table: Graphing Techniques
Transformation | Functional Change | Graph Change |
|---|---|---|
Vertical Shift Up | Shift up k units | |
Vertical Shift Down | Shift down k units | |
Horizontal Shift Right | Shift right h units | |
Horizontal Shift Left | Shift left h units | |
Vertical Stretch | , | Stretch vertically by a |
Vertical Compression | , | Compress vertically by a |
Horizontal Stretch | , | Stretch horizontally by |
Horizontal Compression | , | Compress horizontally by |
Reflection about x-axis | Flip over x-axis | |
Reflection about y-axis | Flip over y-axis |
Applications and Examples
Transformations are used to graph trigonometric, polynomial, and other functions efficiently. For example, the sine function can be shifted, stretched, or reflected to model periodic phenomena.
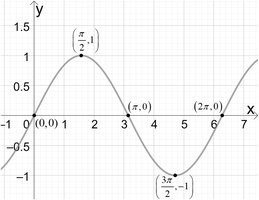
Example: The graph above shows the sine function with key points labeled. Applying transformations can shift, stretch, or reflect this graph to model different periodic behaviors.
Additional info: Understanding transformations is essential for analyzing and graphing all types of functions in precalculus.
