 Back
BackGraphs and Functions: Rectangular Coordinates, Distance, and Midpoint Formulas
Study Guide - Smart Notes
 Tailored notes based on your materials, expanded with key definitions, examples, and context.
Graphs and Functions
Rectangular Coordinates and Ordered Pairs
The rectangular coordinate system, also known as the Cartesian plane, is fundamental for graphing equations and visualizing relationships between variables. Each point in the plane is represented by an ordered pair (x, y), where x is the horizontal coordinate and y is the vertical coordinate.
Ordered Pair: A pair of numbers (a, b) indicating the position of a point relative to the x-axis and y-axis.
Quadrants: The plane is divided into four quadrants, labeled I, II, III, and IV, based on the signs of x and y.
Application: Ordered pairs are used to express relationships, such as category and amount spent: (housing, $19,884).
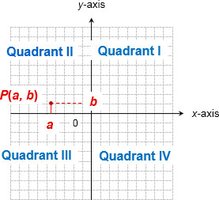
The Rectangular Coordinate System
The rectangular coordinate system consists of two perpendicular axes: the x-axis (horizontal) and the y-axis (vertical). The intersection point is called the origin (0, 0).
Axes: x-axis (horizontal), y-axis (vertical)
Origin: The point (0, 0) where the axes intersect
Quadrants: Each quadrant has a distinct combination of positive and negative values for x and y
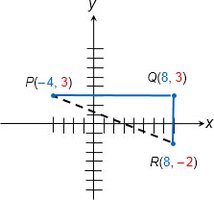
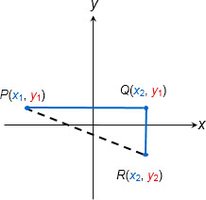
The Distance Formula
The distance formula is used to calculate the distance between two points in the coordinate plane. It is derived from the Pythagorean theorem.
Formula: For points and , the distance is given by:
Application: Used to determine the length between two points, verify right triangles, and check collinearity.
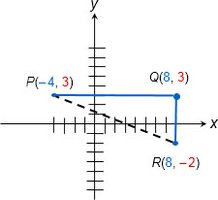
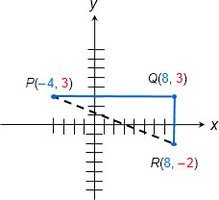
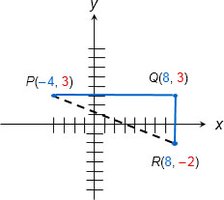
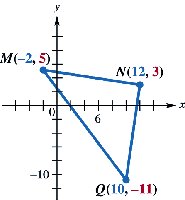
Right Triangles and Collinear Points
Three points form a right triangle if the square of the length of the longest side equals the sum of the squares of the other two sides. Three points are collinear if the sum of the distances between two pairs equals the distance between the remaining pair.
Right Triangle Test:
Collinearity Test: (for points A, B, C)


The Midpoint Formula
The midpoint formula finds the point exactly halfway between two given points in the coordinate plane.
Formula: For endpoints and , the midpoint is:
Application: Used to find the center of a line segment or estimate values between two data points.

Applications of the Midpoint Formula
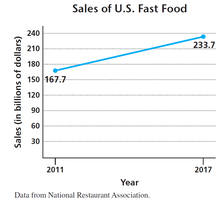
The midpoint formula can be used to estimate intermediate values, such as sales figures between two years.
Example: Estimating sales in 2014 between 2011 ( billion) and 2017 ( billion):
Equations in Two Variables and Ordered-Pair Solutions
An equation in two variables defines a relationship between x and y. Solutions are ordered pairs that satisfy the equation.
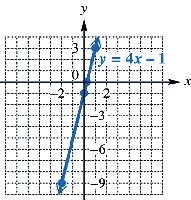
Finding Solutions: Substitute values for x or y and solve for the other variable.
Example: For , substituting gives , so is a solution.
Graphing Equations by Point Plotting
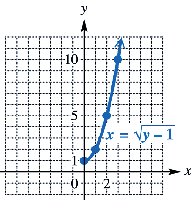
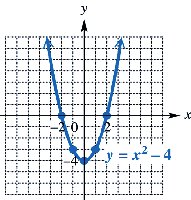
Graphing an equation involves plotting ordered pairs that satisfy the equation and connecting them with a line or curve.
Find the intercepts (where the graph crosses the axes).
Find additional ordered pairs as needed.
Plot the points on the coordinate plane.
Join the points with a smooth line or curve.
Summary Table: Key Formulas
Concept | Formula | Application |
|---|---|---|
Distance between points | Length between two points | |
Midpoint of segment | Center of a line segment | |
Right triangle test | Verify right triangle | |
Collinearity test | Check if points are collinear |
Additional info: These notes expand on the brief points in the original material, providing full academic context, definitions, and examples for each concept. Images included are directly relevant to the explanation of the adjacent paragraphs, visually reinforcing the mathematical concepts.
