 Back
BackGraphs and Functions: Study Guide for Precalculus
Study Guide - Smart Notes
 Tailored notes based on your materials, expanded with key definitions, examples, and context.
Graphs and Functions
Rectangular Coordinate System
The rectangular coordinate system, also known as the Cartesian plane, is a fundamental tool for graphing equations and functions in two dimensions. It consists of two perpendicular axes: the horizontal x-axis and the vertical y-axis. Points are plotted as ordered pairs (x, y), with the origin at (0, 0) where the axes intersect.
Quadrants: The axes divide the plane into four quadrants, numbered counter-clockwise starting from the top-right.
Positive/Negative Values: x-values are positive to the right of the origin and negative to the left; y-values are positive above the origin and negative below.
Example: Plotting points such as A(4, 3), B(−3, 2), C(−2, −3), D(5, −4), E(0,0), F(0, −3) demonstrates the use of ordered pairs.
Equations of Two Variables
Many equations in precalculus involve two variables, typically x and y. The graph of such an equation represents all (x, y) pairs that satisfy the equation.
Checking Solutions: Substitute x and y values into the equation to verify if a point lies on the graph.
Example: For the equation x + y = 5, points like (3, 2) and (4, 1) satisfy the equation, while (0, 0) and (−1, 3) may not.
Graphing Two Variable Equations by Plotting Points
To graph an equation, calculate and plot ordered pairs that make the equation true. This is often done by choosing several x-values, solving for y, and plotting the resulting points.
Steps:
Isolate y:
Calculate y-values for chosen x-values
Plot (x, y) points
Connect points with a line or curve
Example: Graph by creating ordered pairs for x = −2, −1, 0, 1, 2.
Intercepts
Intercepts are points where a graph crosses the axes. The x-intercept is where y = 0, and the y-intercept is where x = 0.
x-intercept: Set y = 0 and solve for x.
y-intercept: Set x = 0 and solve for y.
Example: The intercepts of a graph can be written as ordered pairs.
Slopes of Lines
The slope of a line measures its steepness, calculated as the change in y divided by the change in x between two points.
Slope Formula:
Types of Slope: Positive (upward), negative (downward), zero (horizontal), undefined (vertical).
Example: Find the slope between (−1, 1) and (4, 3).
Slope-Intercept Form
The slope-intercept form of a line is , where m is the slope and b is the y-intercept.
Example: For , the slope is and the y-intercept is 1.
Point-Slope Form
When a line passes through a point (x1, y1) with slope m, use the point-slope form: .
Example: A line with slope − passing through (1, 3): .
Standard Form of a Line
The standard form is . To find slope or intercepts, rewrite in slope-intercept form or set x or y to zero.
Example: For , set y = 0 for x-intercept, x = 0 for y-intercept.
Parallel and Perpendicular Lines
Parallel lines have equal slopes; perpendicular lines have slopes that are negative reciprocals.
Parallel:
Perpendicular:
Relations and Functions
A relation is a set of ordered pairs. A function is a relation where each input (x) has at most one output (y).
Vertical Line Test: If any vertical line crosses the graph more than once, it is not a function.
Function Notation: replaces y.
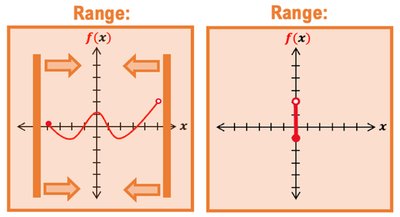
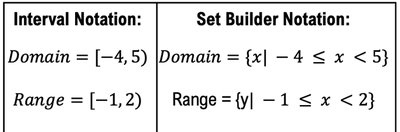
Domain and Range
The domain is the set of allowed x-values; the range is the set of allowed y-values. Use interval notation or set builder notation to express them.
Interval Notation: Uses brackets and parentheses to show inclusion or exclusion.
Set Builder Notation: Uses inequalities to describe the set.
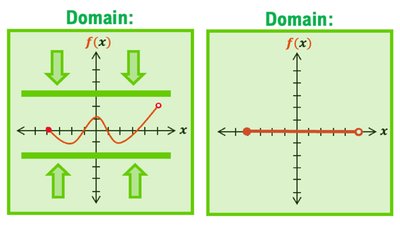
Finding Domain of Equations
To find the domain, identify values that make the function undefined, such as negative values under a square root or zero in a denominator.
Example: For , domain is .
Example: For , domain is .
Graphs of Common Functions
Several basic functions are frequently graphed in precalculus:
Constant Function:
Identity Function:
Square Function:
Cube Function:
Square Root Function:
Cube Root Function:
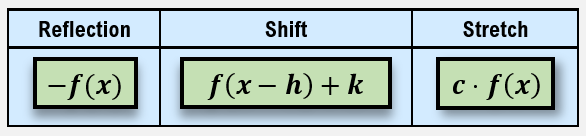
Transformations of Functions
Transformations change the position or shape of a function's graph. The main types are reflection, shift, and stretch.
Reflection: reflects over the x-axis.
Shift: shifts horizontally by h and vertically by k.
Stretch: stretches or compresses the graph.
Function Operations
Functions can be added, subtracted, multiplied, or divided. The domain of the resulting function is the intersection of the domains of the original functions, with additional restrictions for division.
Add/Subtract: Combine like terms.
Multiply:
Divide: , where
Function Composition
Function composition involves substituting one function into another: . The domain is restricted by both functions.
Example: If and , then .
Decomposition: Express a function as a composition of two simpler functions.
Summary Table: Forms of Linear Equations
Slope-Intercept | Point-Slope | Standard |
|---|---|---|
Summary Table: Function Transformations
Reflection | Shift | Stretch |
|---|---|---|
