 Back
BackGraphs of Functions: Identification and Analysis
Study Guide - Smart Notes
 Tailored notes based on your materials, expanded with key definitions, examples, and context.
Functions and Their Graphs
The Graph of a Function
The graph of a function is a visual representation of the set of ordered pairs (x, y) that satisfy the function's equation. Not every collection of points in the xy-plane forms the graph of a function. For a relation to be a function, each x-value in the domain must correspond to exactly one y-value in the range.
Definition: A function is a relation in which each input (x) has exactly one output (y).
Graph of a Function: The set of points (x, y) in the xy-plane that satisfy the function's equation.
Vertical-Line Test
The Vertical-Line Test is a method used to determine whether a graph represents a function. If every vertical line intersects the graph at most once, the graph is a function.
Theorem: A set of points in the xy-plane is the graph of a function if and only if every vertical line intersects the graph in at most one point.
Application: This test helps distinguish functions from non-functions visually.
Examples: Identifying the Graph of a Function
Consider the following graphs:
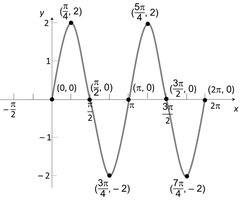
Example 1: The graph below passes the vertical-line test, so it represents a function.
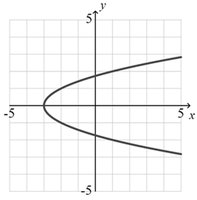
Example 2: The graph below fails the vertical-line test, as some vertical lines intersect the graph at more than one point. Therefore, it does not represent a function.
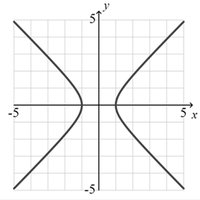
Example 3: The graph below also fails the vertical-line test, so it does not represent a function.
Obtaining Information from the Graph of a Function
Once a graph is confirmed to represent a function, various properties and values can be extracted:
Function Value: If (x, y) is a point on the graph of f, then y = f(x).
Domain: The set of all x-values for which the function is defined.
Range: The set of all y-values that the function attains.
Intercepts: Points where the graph crosses the axes (x-intercepts and y-intercepts).
Intersection with Lines: The number of times a given line (such as y = c) intersects the graph can provide information about the function's behavior.
Example: Analyzing a Function's Graph
Suppose the graph of a function f is given. You can answer questions such as:
What is f(a) for a specific value of a?
What is the domain and range of f?
Where are the intercepts?
For which x-values does f(x) = c?
For which x-values is f(x) > 0 or f(x) < 0?
Application Example: Cost Function for a Flight
Consider a real-world function: The cost C per passenger for a trans-Atlantic flight depends on the ground speed x. The function might be given by an equation such as:
Cost Function: (where k is a constant representing fixed costs)
Domain: The set of possible ground speeds (e.g., x > 0)
Table of Values: To analyze the function, create a table showing C(x) for various values of x.
x | C(x) |
|---|---|
450 | Value at x=450 |
500 | Value at x=500 |
550 | Value at x=550 |
600 | Value at x=600 |
Minimizing Cost: The ground speed that minimizes C(x) can be found by analyzing the graph or table.
Additional info: The actual formula and values for C(x) are not provided in the original material, so the above is a logical academic expansion based on typical cost functions in precalculus applications.
