Back
BackGraphs of Other Trigonometric Functions: Tangent, Cotangent, Secant, and Cosecant
Study Guide - Smart Notes
 Tailored notes based on your materials, expanded with key definitions, examples, and context.
Graphs of Other Trigonometric Functions
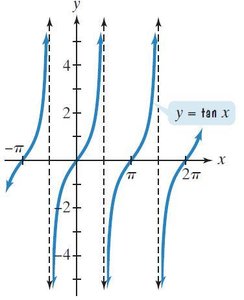
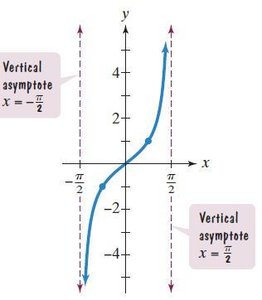
Tangent Function: y = tan x
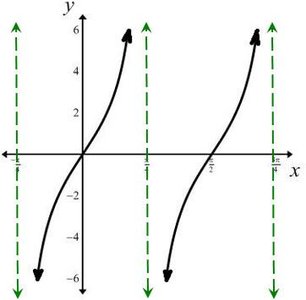
The tangent function is a fundamental trigonometric function with unique graph characteristics. It is defined as the ratio of sine to cosine: . The graph of y = tan x exhibits periodic behavior and vertical asymptotes where the function is undefined.
Period:
Domain: All real numbers except odd multiples of
Range: All real numbers
Vertical Asymptotes: At , where is an integer
Odd Function: (origin symmetry)
x-intercepts: Occur at , midway between consecutive asymptotes
Key Points: At and of the way between asymptotes, y-values are and $1$ respectively
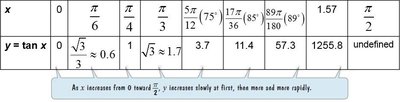
Example Table: Values of y = tan x
x | 0 | 1.57 | ||||||
|---|---|---|---|---|---|---|---|---|
y = tan x | 0 | 1 | 11.4 | 57.3 | 1255.8 | undefined |
As x increases from 0 toward , tan x increases slowly at first, then more and more rapidly.
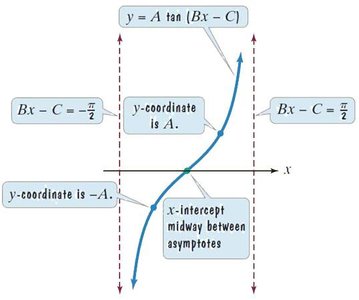
Graphing Variations of y = tan x
To graph , follow these steps:
Find two consecutive asymptotes by solving
Identify the x-intercept midway between the asymptotes
Find points at and of the way between asymptotes, with y-coordinates and
Graph one full period and extend as needed
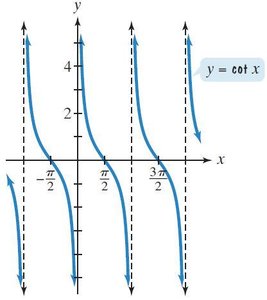
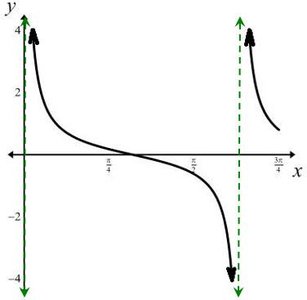
Cotangent Function: y = cot x
The cotangent function is the reciprocal of the tangent function: . Its graph has similar properties but different locations for asymptotes and intercepts.
Period:
Domain: All real numbers except integral multiples of
Range: All real numbers
Vertical Asymptotes: At , where is an integer
Odd Function: (origin symmetry)
x-intercepts: Occur midway between consecutive asymptotes
Key Points: At of the way between asymptotes, y-values are $1-1$ respectively
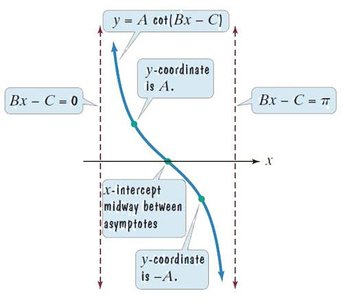
Graphing Variations of y = cot x
To graph , follow these steps:
Find two consecutive asymptotes by solving
Identify the x-intercept midway between the asymptotes
Find points at and of the way between asymptotes, with y-coordinates and
Graph one full period and extend as needed
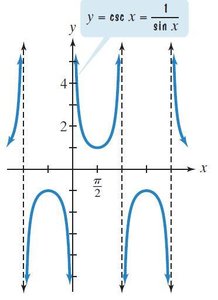
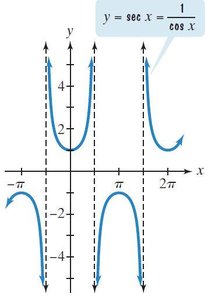
Cosecant and Secant Functions: y = csc x and y = sec x
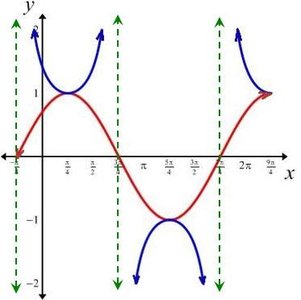
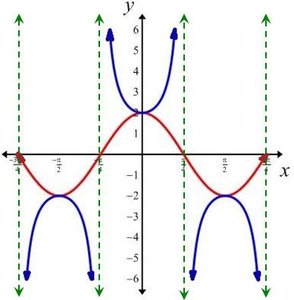
The cosecant and secant functions are the reciprocals of sine and cosine, respectively. Their graphs are constructed by taking the reciprocal of the y-values of the sine and cosine graphs, resulting in vertical asymptotes at the x-intercepts of the original functions.
Cosecant:
Secant:
Period:
Domain: All real numbers except where sine or cosine is zero
Range:
Vertical Asymptotes: At x-intercepts of sine (for csc) and cosine (for sec)
Symmetry: Cosecant is odd, secant is even
Example: Constructing the Cosecant Curve from the Sine Curve
To graph , use the graph of and draw vertical asymptotes at its x-intercepts. The reciprocal values form the branches of the cosecant curve.
Example: Graphing a Secant Function
To graph , first graph , then use its x-intercepts as vertical asymptotes for the secant graph. The secant curve consists of branches above and below the cosine curve, where the reciprocal values are defined.
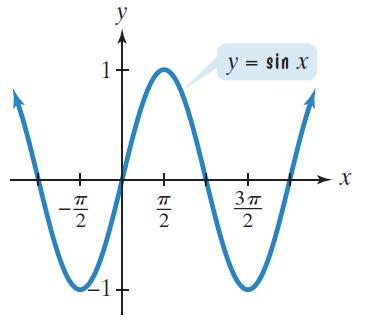
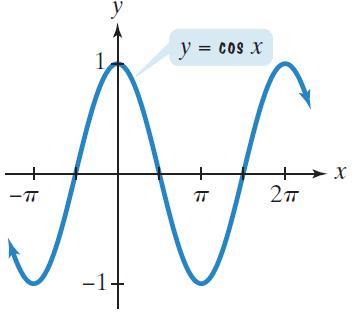
Summary Table: The Six Trigonometric Curves
Function | Domain | Range | Period |
|---|---|---|---|
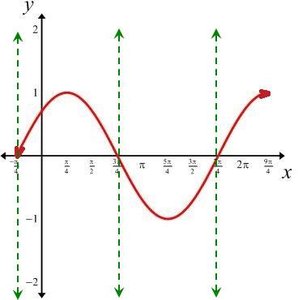
y = sin x | All real numbers | [-1, 1] | |
y = cos x | All real numbers | [-1, 1] | |
y = tan x | All real numbers except odd multiples of | All real numbers | |
y = cot x | All real numbers except integral multiples of | All real numbers | |
y = csc x | All real numbers except integral multiples of | ||
y = sec x | All real numbers except odd multiples of |
Visual Summary of Trigonometric Curves