 Back
BackGraphs of Sine and Cosine Functions: Amplitude, Period, and Transformations
Study Guide - Smart Notes
 Tailored notes based on your materials, expanded with key definitions, examples, and context.
Trigonometric Functions
Introduction to Sine and Cosine Functions
The sine and cosine functions are fundamental periodic functions in trigonometry, widely used to model oscillatory phenomena. Their graphs exhibit regular patterns characterized by amplitude, period, and symmetry.
Graphs of the Sine Function
Key Values and Graph of y = sin x
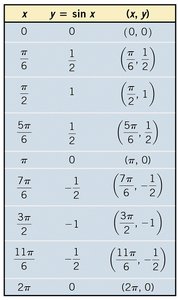
The sine function, y = sin x, oscillates between -1 and 1 and is periodic with period . The table below shows key values for y = sin x:
x | y = sin x | (x, y) |
|---|---|---|
0 | 0 | (0, 0) |
(, ) | ||
1 | (, 1) | |
(, ) | ||
0 | (, 0) | |
(, ) | ||
-1 | (, -1) | |
(, ) | ||
0 | (, 0) |
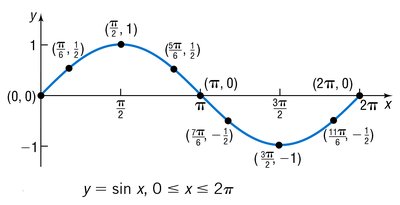
The graph of y = sin x for is shown below:
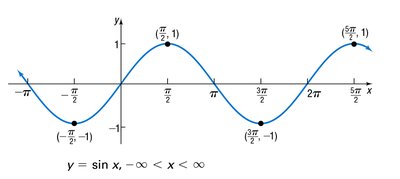
For all real x, the graph repeats every :
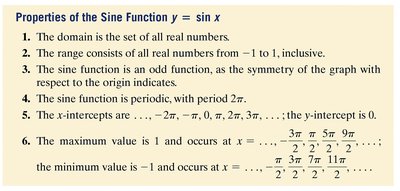
Properties of the Sine Function
Domain: All real numbers.
Range: .
Odd Function: Symmetric about the origin; .
Periodicity: Period .
x-intercepts:
Maximum: 1 at
Minimum: -1 at
Graphs of the Cosine Function
Key Values and Graph of y = cos x
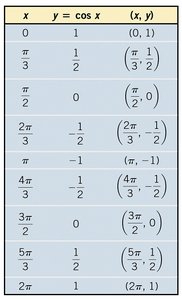
The cosine function, y = cos x, also oscillates between -1 and 1 and is periodic with period . The table below shows key values for y = cos x:
x | y = cos x | (x, y) |
|---|---|---|
0 | 1 | (0, 1) |
(, ) | ||
0 | (, 0) | |
(, ) | ||
-1 | (, -1) | |
(, ) | ||
0 | (, 0) | |
(, ) | ||
1 | (, 1) |
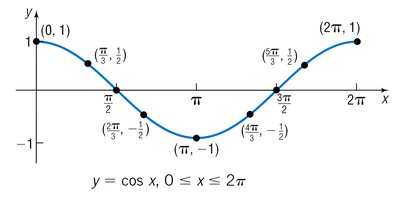
The graph of y = cos x for is shown below:
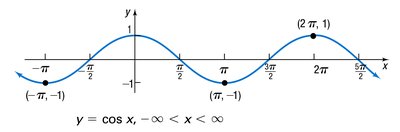
For all real x, the graph repeats every :
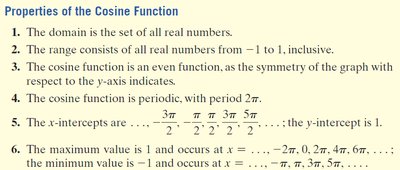
Properties of the Cosine Function
Domain: All real numbers.
Range: .
Even Function: Symmetric about the y-axis; .
Periodicity: Period .
x-intercepts:
Maximum: 1 at
Minimum: -1 at
Transformations of Sine and Cosine Functions
Amplitude and Period
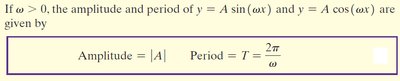
For functions of the form y = A sin(\omega x) or y = A cos(\omega x), the amplitude and period are determined by the constants A and :
Amplitude:
Period:
Vertical Stretch and Horizontal Compression
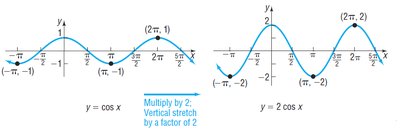
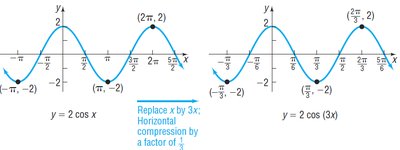
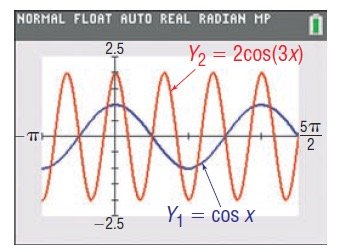
Multiplying by A stretches or compresses the graph vertically. Replacing x by compresses or stretches the graph horizontally.
Vertical Stretch: is twice as tall as .
Horizontal Compression: compresses the period by a factor of .

Graphing Sinusoidal Functions Using Key Points
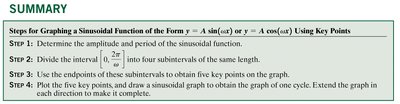
Steps for Graphing y = A sin(\omega x) or y = A cos(\omega x)
To graph a sinusoidal function, follow these steps:
Determine the amplitude and period.
Divide the interval into four equal subintervals.
Use the endpoints to obtain five key points.
Plot the points and draw the graph for one cycle. Extend as needed.
Example: Graphing y = 2 sin(2x)
For y = 2 sin(2x):
Amplitude: 2
Period:
Key x-coordinates:
Key points: (0,0), (,2), (,0), (,-2), (,0)
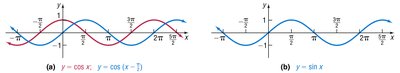
Relationship Between Sine and Cosine
Phase Shift
The sine and cosine functions are related by a phase shift:
Summary Table: Steps for Graphing Sinusoidal Functions
Step | Description |
|---|---|
1 | Determine amplitude and period |
2 | Divide interval into four equal parts |
3 | Find five key points |
4 | Plot points and draw one cycle |
Conclusion
Understanding the graphs, properties, and transformations of sine and cosine functions is essential for mastering trigonometric concepts in precalculus. These functions model periodic behavior and are foundational for further study in mathematics and science.
