 Back
BackIntroduction to Functions: Concepts, Notation, and Graphical Analysis
Study Guide - Smart Notes
 Tailored notes based on your materials, expanded with key definitions, examples, and context.
Functions and Their Properties
Definition of a Function
A function is a rule, formula, graph, or table that assigns each value from a set called the domain to exactly one value in a set called the range. The essential property of a function is that each input (x-value) is paired with only one output (y-value).
Domain: The set of all possible input values (x-values).
Range: The set of all possible output values (y-values).
Example: Consider the following equations. Determine if each represents a function by solving for y and checking if each x yields only one y.
To determine if an equation is a function, solve for y and check if for every x there is only one y. If solving for y introduces a ± (plus-minus), the equation does not represent a function.
The Vertical Line Test
The Vertical Line Test is a graphical method to determine if a graph represents a function. If any vertical line crosses the graph more than once, the graph does not represent a function.
If a vertical line intersects the graph at more than one point, the relation is not a function.
If every vertical line intersects the graph at most once, the relation is a function.
Function Notation and Evaluation
Function Notation
Function notation is a way to name functions and specify their input and output variables. The most common notation is , where f names the function and x is the input variable. Other letters such as g or h may also be used for functions, and t for the input variable.
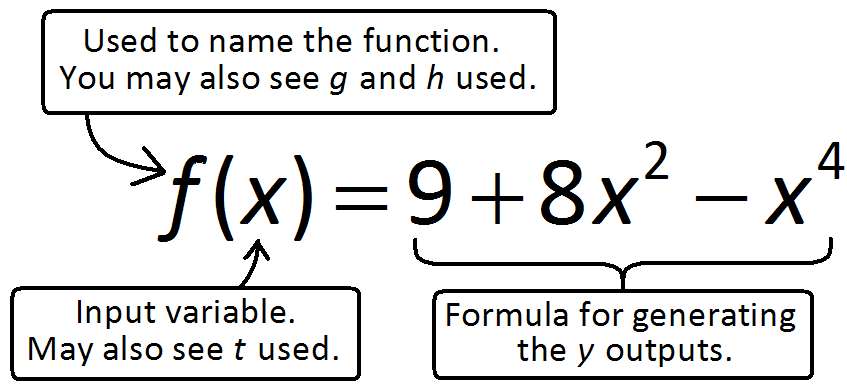
f(x): The value of the function f at input x.
Example: For , evaluate , , , by substituting the input into the formula.
Graphing Functions and Analyzing Graphs
Graphing a Function
To graph a function such as , use a graphing calculator or plotting software. Important features to identify include:
x-intercepts: Points where the graph crosses the x-axis ().
y-intercept: Point where the graph crosses the y-axis ().
Relative maximum/minimum: Highest/lowest points in a local region of the graph.
Domain and Range: The set of all x-values and y-values represented on the graph.
Increasing and Decreasing Intervals
A function is increasing on intervals where its graph rises as x increases, and decreasing where it falls. These intervals are determined by the x-values between relative minima and maxima.
Increasing: increases as x increases.
Decreasing: decreases as x increases.
To find these intervals, identify the x-values at which the function changes from increasing to decreasing (relative extrema).
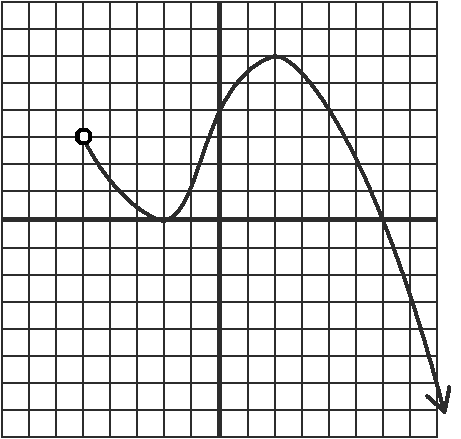
Determining Information from a Graph
Given the graph of a function, you can determine:
Domain: The set of x-values for which the function is defined.
Range: The set of y-values the function attains.
Intercepts: Where the graph crosses the axes.
Relative maxima/minima: Highest/lowest points in a region.
Function values: for a given x-value a.
Intervals of increase/decrease: Where the function rises or falls.
Piecewise Functions
Definition and Evaluation
Piecewise functions are defined by different formulas on different intervals of the domain. Each formula applies to a specific range of x-values, indicated by inequalities.
Example:
To evaluate , , , substitute the x-value into the appropriate formula based on the inequality.
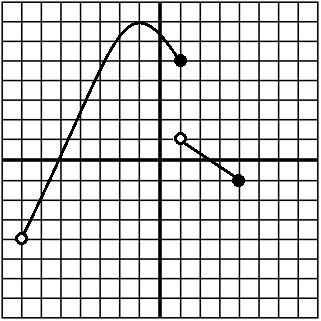
To graph a piecewise function, plot each formula on its specified interval, often marking endpoints with open or closed circles to indicate inclusion or exclusion.

The Difference Quotient
Definition and Simplification
The difference quotient is an expression used in calculus to define the derivative of a function. For a function , the difference quotient is:
To simplify, first compute by substituting into the function.
Subtract from .
Divide the result by and simplify.
Example: For , compute and simplify the difference quotient.
This process is foundational for understanding derivatives in calculus.
