 Back
BackPhase Shift and Sinusoidal Curve Fitting in Trigonometric Functions
Study Guide - Smart Notes
 Tailored notes based on your materials, expanded with key definitions, examples, and context.
Trigonometric Functions: Phase Shift and Sinusoidal Curve Fitting
Introduction to Sinusoidal Functions
Sinusoidal functions, such as sine and cosine, are fundamental in modeling periodic phenomena. The general form of a sinusoidal function is:
y = A \sin(\omega x - \phi) + B or y = A \cos(\omega x - \phi) + B
where:
A is the amplitude (vertical stretch/shrink)
\omega is the angular frequency (affects period)
\phi is the phase shift (horizontal translation)
B is the vertical shift
Key Properties of Sinusoidal Functions
Amplitude: |A| (the maximum displacement from the midline)
Period:
Phase Shift: (to the left if , to the right if )
Vertical Shift: B (moves the graph up or down)
Graphing Sinusoidal Functions
Step-by-Step Graphing Process
To graph a function of the form y = A \sin(\omega x - \phi) + B or y = A \cos(\omega x - \phi) + B:
Identify amplitude, period, phase shift, and vertical shift.
Determine the interval for one cycle:
Divide the interval into four equal subintervals to find five key points.
Plot the key points and sketch the curve.
Example 1: Graphing
Amplitude:
Period:
Phase Shift: to the right
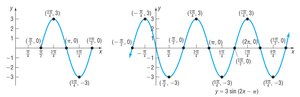
The graph oscillates between -3 and 3. One cycle starts at and ends at .
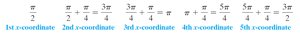
Divide the interval into four subintervals to find the five key x-coordinates:
, , , ,
Plot these points and sketch the curve:

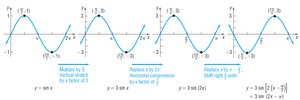
Alternatively, the graph can be constructed using transformations:
Example 2: Graphing
Amplitude:
Period:
Phase Shift: to the left
Vertical Shift: Down 1 unit
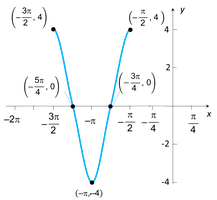
The graph oscillates between -5 and 3. One cycle starts at and ends at .
Plot the five key points and sketch the curve:
Sinusoidal Curve Fitting
Introduction to Curve Fitting
Sinusoidal curve fitting involves finding a sine or cosine function that best models a set of periodic data. This is useful in applications such as temperature modeling, daylight hours, and other naturally repeating phenomena.
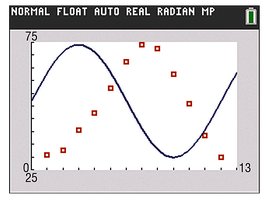
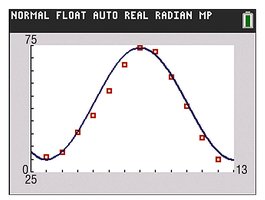
Example 3: Fitting a Sine Function to Temperature Data
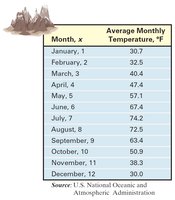
Given average monthly temperature data, fit a sine function to model the data.
Month, x | Average Monthly Temperature, °F |
|---|---|
January, 1 | 30.7 |
February, 2 | 32.5 |
March, 3 | 40.4 |
April, 4 | 47.4 |
May, 5 | 57.1 |
June, 6 | 67.4 |
July, 7 | 74.2 |
August, 8 | 72.5 |
September, 9 | 63.4 |
October, 10 | 50.9 |
November, 11 | 38.3 |
December, 12 | 30.0 |
Step 1: Plot the data as a scatter diagram.
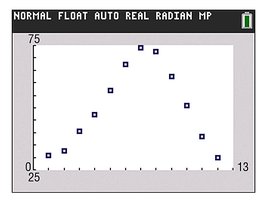
Step 2: Estimate the amplitude as half the difference between the maximum and minimum values.
Step 3: Estimate the vertical shift as the average of the maximum and minimum values.
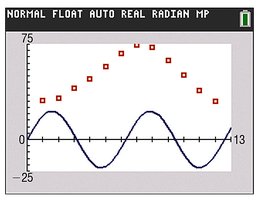
Step 4: Determine the period (here, months), so .
Step 5: Find the phase shift by comparing the location of the maximum in the data to the standard sine curve.
General Steps for Fitting a Sine Function to Data
Determine amplitude :
Determine vertical shift :
Determine : , where is the period of the data
Determine phase shift : Compare the x-coordinate of the maximum in the data to the standard sine curve
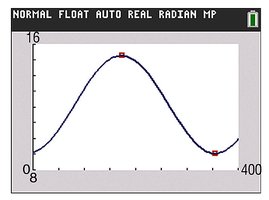
Example 4: Modeling Hours of Daylight
Given the maximum and minimum hours of sunlight in Boston, fit a sinusoidal function and use it to predict values.
Maximum: 15.28 hours (summer solstice, day 172)
Minimum: 9.07 hours (winter solstice)
Period: 365 days
Follow the same steps as above to find , , , and . Use the resulting function to predict the number of daylight hours on a given day and compare with actual data.
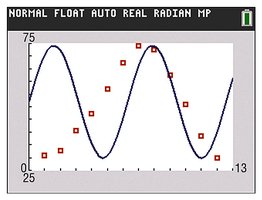
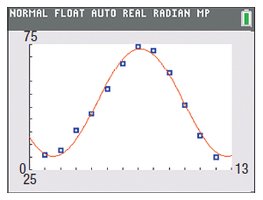
Example 5: Sine Regression with a Graphing Utility
Use a calculator or software to perform a sine regression on periodic data. The regression provides the best-fit parameters for .

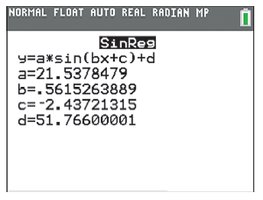
The resulting function might be:
Additional info: Sinusoidal curve fitting is widely used in science and engineering to model periodic phenomena such as sound waves, seasonal temperatures, and daylight hours. Understanding how to extract amplitude, period, phase shift, and vertical shift from data is essential for interpreting and predicting real-world cycles.
