Back
BackPolynomial and Rational Functions: Key Concepts and Graphs
Study Guide - Smart Notes
 Tailored notes based on your materials, expanded with key definitions, examples, and context.
Polynomial Functions and Their Properties
Terminology and Structure of Polynomial Functions
Polynomial functions are fundamental objects in algebra and precalculus, defined as expressions of the form , where and is a non-negative integer. Understanding their structure and terminology is essential for graphing and analyzing their behavior.
Degree: The highest power of in the polynomial. Determines the general shape and end behavior of the graph.
Leading Term: The term with the highest degree ().
Leading Coefficient: The coefficient of the leading term.
Constant Term: The term (no factor).
Power Function: A function of the form .
Real Zero: A real value such that .
Multiplicity: The number of times a zero is repeated as a factor.
Turning Points: Points where the graph changes direction; a polynomial of degree has at most turning points.
End Behavior: The behavior of as or .
Key Properties:
The domain of a polynomial function is all real numbers.
The graph is smooth and continuous (no breaks or holes).
At a zero of even multiplicity, the graph touches the x-axis; at odd multiplicity, it crosses.
Graphing Polynomial Functions
Steps for Graphing
To accurately graph a polynomial function, follow these systematic steps:
Determine End Behavior: Use the degree and leading coefficient to predict how the graph behaves as .
Find Intercepts: Calculate the y-intercept () and solve for x-intercepts.
Analyze Zeros and Multiplicities: Identify each real zero and its multiplicity to determine if the graph crosses or touches the x-axis at each intercept.
Turning Points: The maximum number is for degree .
Plot Additional Points: Evaluate at values between and beyond the zeros to refine the graph.
Example: Graphing a Cubic Polynomial
Consider . The zeros are (all multiplicity 1, so the graph crosses the x-axis at each). The degree is 3, so the end behavior is as and as .
The Real Zeros of a Polynomial Function
Equivalence of Zeros, Factors, and Solutions
For a polynomial and a real number :
is a real zero of if .
is an x-intercept of the graph of .
is a factor of .
is a real solution to .
Remainder and Factor Theorems
Remainder Theorem: If is divided by , the remainder is .
Factor Theorem: is a factor of if and only if .
Descarte’s Rule of Signs
Descarte’s Rule of Signs helps estimate the number of positive and negative real zeros:
The number of positive real zeros equals the number of sign changes in or less by an even integer.
The number of negative real zeros equals the number of sign changes in or less by an even integer.
Rational Zero Theorem
If has integer coefficients, any rational zero must have dividing the constant term and dividing the leading coefficient.
Example: Finding Real Zeros and Factoring
Given :
Degree 3: at most 3 real zeros.
By Descarte’s Rule, one positive and two or zero negative real zeros.
Potential rational zeros: .
Testing gives , so is a factor.
Factoring further: .
Zeros: .
Properties and Graphs of Rational Functions
Key Properties of Rational Functions
A rational function is a ratio of two polynomials: .
Domain: All real numbers except where .
Vertical Asymptotes: At real zeros of (where denominator is zero and numerator is nonzero).
Horizontal Asymptotes:
If degree of numerator < degree of denominator: .
If degrees are equal: (ratio of leading coefficients).
If degree of numerator > degree of denominator: no horizontal asymptote.
Oblique (Slant) Asymptotes: If degree of numerator is exactly one more than denominator, use long division to find .
Example: Graph of a Rational Function
Consider . The domain excludes . Vertical asymptotes at and . Horizontal asymptote at .
Analyzing and Graphing Rational Functions
Factor numerator and denominator; find the domain.
Simplify to lowest terms.
Find and plot intercepts; use multiplicity for x-intercepts.
Find and graph vertical asymptotes (dashed lines).
Find and graph horizontal or oblique asymptotes; plot intersection points if any.
Divide the x-axis into intervals using zeros of numerator and denominator.
Sketch the graph using all information above.
Practice: Classification and Analysis of Functions
Identifying Function Types
Polynomial Function: (degree 5)
Rational Function:
Neither: (contains a non-integer exponent)
Polynomial Function: (degree 0)
Graphing Practice Polynomials
For each function, determine end behavior, intercepts, zeros and their multiplicities, and maximum number of turning points. Use this information to sketch the graph.
Example: has zeros at ; has multiplicity 2 (touches x-axis), others cross.
Summary Table: Asymptotes and Domain of Rational Functions
Function | Domain | Horizontal Asymptote | Vertical Asymptote | Oblique Asymptote |
|---|---|---|---|---|
None | ||||
None | Yes | |||
None | ||||
None |
Additional Practice: Zeros, Multiplicity, and End Behavior
Multiplicity: If a zero has even multiplicity, the graph touches the x-axis; if odd, it crosses.
Maximum Turning Points: For degree , at most turning points.
End Behavior: Determined by the leading term.
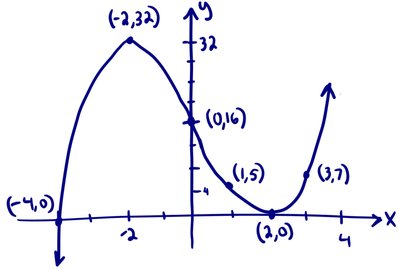
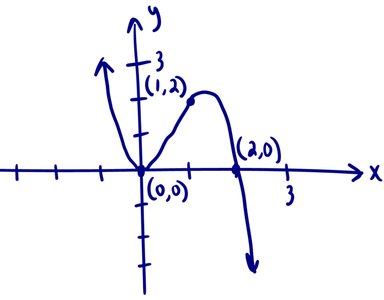
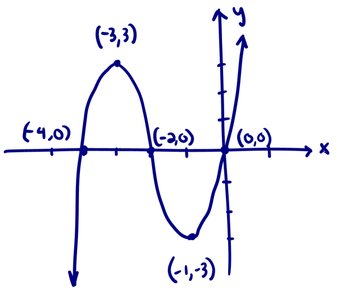
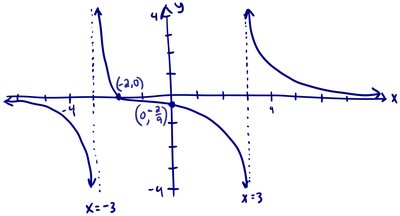
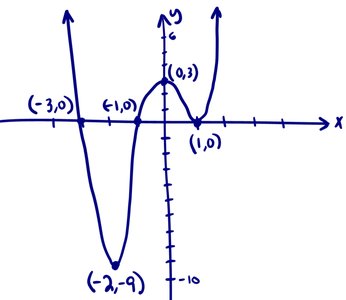
Sample Graphs for Practice Problems
The following images correspond to the graphs of polynomial and rational functions analyzed in the practice problems above. Each graph illustrates zeros, turning points, and asymptotic behavior as discussed.