 Back
BackPrecalculus Probability and Counting Principles Study Guide
Study Guide - Smart Notes
 Tailored notes based on your materials, expanded with key definitions, examples, and context.
Q1. Probability of Students Wearing Socks
Background
Topic: Binomial Probability
This question tests your understanding of the binomial probability distribution, which models the probability of a fixed number of successes in a fixed number of independent trials, each with the same probability of success.
Key Terms and Formulas
Binomial Probability Formula:
n = number of trials (students chosen)
k = number of successes (students wearing socks)
p = probability of success (student wears socks)
Step-by-Step Guidance
Identify the values: , (probability a student wears socks).
For each part (a–d), determine the value of (number of students wearing socks) or the range of values.
Set up the binomial probability formula for each scenario:
(a) All wearing socks:
(b) None wearing socks:
(c) At least 7 wearing socks: (sum probabilities for these values)
(d) Exactly 1 wearing socks:
For (c), remember to add the probabilities for each value from 7 to 10.
Try solving on your own before revealing the answer!
Q2. Minimum Number of Sensors for Desired Certainty
Background
Topic: Binomial Probability and Cumulative Probability
This question asks you to determine the minimum number of sensors needed so that the probability of at least one detecting movement exceeds 97%.
Key Terms and Formulas
Probability at least one detects:
Probability none detect:
p = probability a sensor detects movement (0.80)
n = number of sensors (what you are solving for)
Step-by-Step Guidance
Express the probability that at least one sensor detects movement: .
Set up the inequality: .
Rearrange to solve for .
Take the logarithm of both sides to isolate .
Try solving on your own before revealing the answer!
Q3. Tim's Free-Throw Probability and Distribution
Background
Topic: Binomial Distribution – Mean, Standard Deviation, and Probability Histogram
This question involves calculating the expected value (mean), standard deviation, and probability distribution for a binomial experiment.
Key Terms and Formulas
Mean:
Standard deviation:
Probability for successes:
n = 8, p = 0.82
Step-by-Step Guidance
Calculate the mean: .
Calculate the standard deviation: .
For the histogram, compute for using the binomial formula.
Sketch or list the probabilities for each value of to form the histogram.
Try solving on your own before revealing the answer!
Q4. Comparing Probabilities for Tim's Free Throws
Background
Topic: Cumulative Binomial Probability
This question asks you to compare the probability of Tim making 6 or fewer shots versus 7 or more out of 8 attempts.
Key Terms and Formulas
Cumulative probability: and
Use the binomial probability formula for each value and sum as needed.
Step-by-Step Guidance
Calculate by summing probabilities for to $6$.
Calculate by summing probabilities for and $8$.
Compare the two probabilities to determine which is more likely.
Try solving on your own before revealing the answer!
Q5. Criteria of a Binomial Experiment
Background
Topic: Binomial Experiment Properties
This question tests your understanding of the defining characteristics of a binomial experiment.
Key Terms
Binomial experiment: An experiment that meets specific criteria for binomial probability.
Step-by-Step Guidance
Recall the properties: fixed number of trials, only two possible outcomes per trial, etc.
List each criterion clearly and concisely.
Think about why each criterion is necessary for the binomial model to apply.
Try solving on your own before revealing the answer!
Q6. Probability of Winning a Board Game with Dice
Background
Topic: Probability with Dice and Binomial Probability
This question involves finding the probability of a specific event with dice, and then using the binomial model to find the probability of that event occurring multiple times in repeated trials.
Key Terms and Formulas
Probability of a single event with dice (counting outcomes)
Binomial probability for repeated independent events
Step-by-Step Guidance
List all possible outcomes for rolling two dice and adding the numbers.
Count the number of outcomes that result in a sum of 8 or at least one die showing a 6.
Calculate the probability of winning in one roll.
Set up the binomial probability formula for winning 3 times out of 8 rolls using the probability from the previous step.
Try solving on your own before revealing the answer!
Q7. Probability of Accepting a Yogurt Shipment
Background
Topic: Binomial Probability – Quality Control
This question asks you to find the probability that, in a sample of 16 yogurts, no more than 2 have open lids, given a 95% success rate for closed lids.
Key Terms and Formulas
n = 16, p = 0.95 (probability lid is on)
Probability of at most 2 open lids: sum probabilities for 0, 1, and 2 open lids
Use the binomial probability formula for each value of k (number of open lids)
Step-by-Step Guidance
Let k = number of open lids (so probability of open lid is 0.05).
Calculate , , and using the binomial formula.
Add these probabilities to find the total probability of accepting the shipment.
Try solving on your own before revealing the answer!
Q8. Probability of Passing a Multiple Choice Test by Guessing
Background
Topic: Binomial Probability – Multiple Choice Tests
This question asks you to find the probability of getting at least 6 correct answers out of 10 by guessing, with 4 choices per question.
Key Terms and Formulas
n = 10, p = 0.25 (probability of guessing correctly)
Probability of at least 6 correct: sum probabilities for k = 6, 7, 8, 9, 10
Use the binomial probability formula for each value of k
Step-by-Step Guidance
Set up the binomial probability formula for each value of k from 6 to 10.
Calculate each probability and add them together to find the total probability of passing.
Try solving on your own before revealing the answer!
Chapter 4 Q1. Counting Outcomes (Combinations and Permutations)
Background
Topic: Counting Principles – Combinations and Permutations
This question tests your ability to distinguish between combinations (order does not matter) and permutations (order matters) and to use the appropriate formulas.
Key Terms and Formulas
Combinations:
Permutations:
Step-by-Step Guidance
For each part, determine if order matters (permutation) or not (combination).
Set up the appropriate formula for each scenario:
(a) Choosing jewelry: combination
(b) Selecting students: combination
(c) Assigning prizes: permutation
(d) Arranging posters: permutation
Plug in the values for n and r for each part and simplify the expressions.
Try solving on your own before revealing the answer!
Chapter 4 Q2. Probability with Letters in "CAULIFLOWER"
Background
Topic: Basic Probability with Counting
This question involves finding probabilities by counting favorable outcomes and dividing by the total number of possible outcomes.
Key Terms and Formulas
Probability:
Combinations for drawing two cards:
Step-by-Step Guidance
Count the total number of letters in "CAULIFLOWER".
For each part, count the number of favorable outcomes (e.g., vowels, L's, etc.).
For two cards, use combinations to count the number of ways to draw two vowels, two consonants, or one of each.
Try solving on your own before revealing the answer!
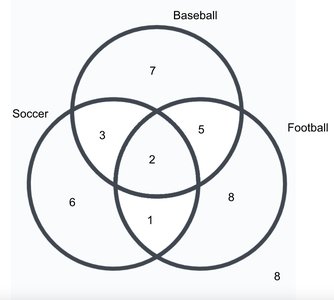
Chapter 4 Q3. Venn Diagram Probability
Background
Topic: Venn Diagrams and Probability
This question asks you to use a Venn diagram to find probabilities involving unions, intersections, and complements of sets.
Key Terms and Formulas
Union:
Intersection:
Complement:
Conditional probability:
Step-by-Step Guidance
For each part, identify which regions of the Venn diagram correspond to the event described.
Add the numbers in the relevant regions to find the numerator (favorable outcomes).
Find the total number of students by adding all numbers in the diagram.
Set up the probability as a fraction: .
For conditional probability, use .
Try solving on your own before revealing the answer!
