 Back
BackPrecalculus Study Guidance: Functions, Graphs, Domains, and Transformations
Study Guide - Smart Notes
 Tailored notes based on your materials, expanded with key definitions, examples, and context.
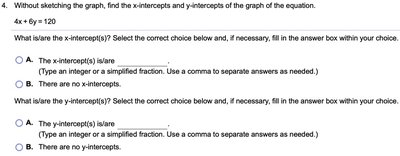
Q4. Without sketching the graph, find the x-intercepts and y-intercepts of the equation 4x + 6y = 120.
Background
Topic: Linear Equations and Intercepts
This question tests your ability to find the x- and y-intercepts of a linear equation by setting one variable to zero and solving for the other.
Key Terms and Formulas
x-intercept: The point(s) where the graph crosses the x-axis (y = 0).
y-intercept: The point(s) where the graph crosses the y-axis (x = 0).
Step-by-Step Guidance
To find the x-intercept(s), set in the equation and solve for .
To find the y-intercept(s), set in the equation and solve for .
Write your answers as points: for x-intercepts and for y-intercepts.
Try solving on your own before revealing the answer!
Final Answer:
x-intercept: y-intercept:
Setting gives . Setting gives .
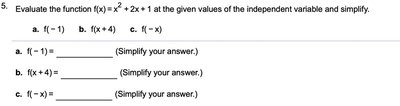
Q5. Evaluate the function at the given values and simplify.
Background
Topic: Function Evaluation
This question tests your ability to substitute values into a quadratic function and simplify the result.
Key Terms and Formulas
Function evaluation: Substitute the given value for in .
Quadratic function:
Step-by-Step Guidance
For , substitute into : .
For , substitute for : .
For , substitute for : .
Simplify each expression step by step, combining like terms.
Try solving on your own before revealing the answer!
Final Answer:
Each value is found by direct substitution and simplification.
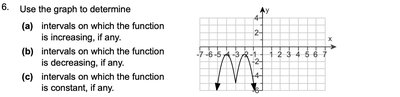
Q6. Use the graph to determine intervals where the function is increasing, decreasing, or constant.
Background
Topic: Intervals of Increase/Decrease/Constancy
This question tests your ability to read a graph and identify where the function rises, falls, or remains unchanged.
Key Terms
Increasing interval: Where the graph goes up as increases.
Decreasing interval: Where the graph goes down as increases.
Constant interval: Where the graph is flat (horizontal).
Step-by-Step Guidance
Look at the graph and identify the -intervals where the function rises (increasing).
Identify the -intervals where the function falls (decreasing).
Check for any intervals where the function is constant (horizontal line).
Write the intervals using proper notation, such as for increasing, etc.
Try solving on your own before revealing the answer!
Final Answer:
Increasing: and Decreasing: and Constant: No intervals
Intervals are determined by observing the direction of the graph.
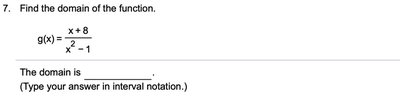
Q7. Find the domain of the function .
Background
Topic: Domain of Rational Functions
This question tests your ability to find the domain of a rational function by identifying values that make the denominator zero.
Key Terms and Formulas
Domain: All real -values for which the function is defined.
Rational function: A function of the form .
Step-by-Step Guidance
Set the denominator equal to zero and solve for .
Find the values of that make the denominator zero; these must be excluded from the domain.
Write the domain in interval notation, excluding the problematic values.
Try solving on your own before revealing the answer!
Final Answer:
Domain:
The function is undefined at and because the denominator is zero.
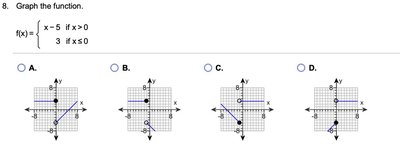
Q8. Graph the function
Background
Topic: Piecewise Functions
This question tests your ability to interpret and graph a piecewise-defined function.
Key Terms
Piecewise function: A function defined by different expressions on different intervals.
Step-by-Step Guidance
For , graph the line only for .
For , graph the constant function for .
Pay attention to open and closed circles at to indicate which part of the function includes .
Try solving on your own before revealing the answer!
Final Answer:
The correct graph is option B.
For , the graph is a horizontal line at . For , the graph is a line with slope 1 and y-intercept -5.
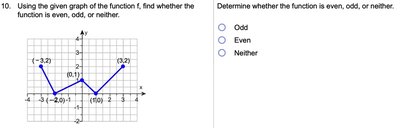
Q10. Using the given graph, determine whether the function is even, odd, or neither.
Background
Topic: Symmetry of Functions
This question tests your ability to determine the symmetry of a function from its graph.
Key Terms
Even function: Symmetric about the y-axis ().
Odd function: Symmetric about the origin ().
Neither: If the function does not have either symmetry.
Step-by-Step Guidance
Check if the graph is symmetric about the y-axis (mirror image left and right).
Check if the graph is symmetric about the origin (rotational symmetry).
If neither symmetry is present, the function is neither even nor odd.
Try solving on your own before revealing the answer!
Final Answer:
The function is neither even nor odd.
The graph does not show symmetry about the y-axis or the origin.
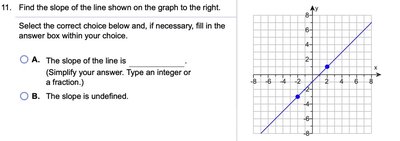
Q11. Find the slope of the line shown on the graph.
Background
Topic: Slope of a Line
This question tests your ability to calculate the slope of a line given two points on its graph.
Key Terms and Formulas
Slope formula:
Step-by-Step Guidance
Identify two points on the line from the graph, such as and .
Plug the coordinates into the slope formula: .
Simplify the fraction to find the slope.
Try solving on your own before revealing the answer!
Final Answer:
The slope of the line is $1$.
Using two points, the change in divided by the change in gives .
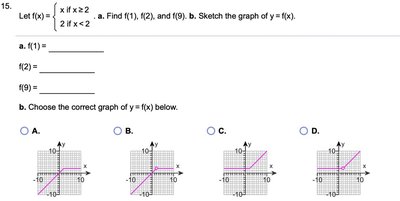
Q15. Let . Find , , and . Sketch the graph of .
Background
Topic: Piecewise Functions and Graphing
This question tests your ability to evaluate and graph a piecewise function.
Key Terms
Piecewise function: Defined by different expressions for different intervals of .
Step-by-Step Guidance
For , since , use the second piece: .
For , since , use the first piece: .
For , since , use the first piece: .
To sketch the graph, plot for and for .
Try solving on your own before revealing the answer!
Final Answer:
, , The correct graph is option C.
The function is constant at for and linear for .
Q20. Find the equation of the line passing through the points and . Write in slope-intercept form.
Background
Topic: Equation of a Line
This question tests your ability to find the equation of a line given two points.
Key Terms and Formulas
Slope formula:
Slope-intercept form:
Step-by-Step Guidance
Calculate the slope using the two points: .
Use the point-slope form: , then solve for .
Substitute one of the points and the slope to find the y-intercept .
Try solving on your own before revealing the answer!
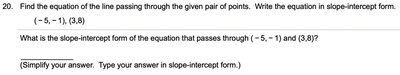
Final Answer:
The slope is $1.
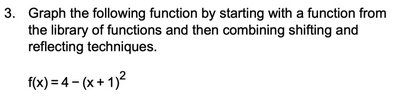
Q3. Graph by starting with a library function and applying shifting and reflecting techniques.
Background
Topic: Transformations of Functions
This question tests your understanding of how to graph quadratic functions using transformations.
Key Terms and Formulas
Library function:
Transformation: Shifting, reflecting, and vertical translation.
Step-by-Step Guidance
Start with the basic parabola .
Apply a horizontal shift left by 1 unit: .
Reflect the graph over the x-axis: .
Shift the graph up by 4 units: .
Try solving on your own before revealing the answer!
Final Answer:
The graph is a downward-opening parabola with vertex at .
Each transformation is applied in sequence to the parent function.
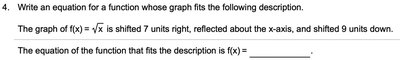
Q4. Write an equation for a function whose graph fits the following description: The graph of is shifted 7 units right, reflected about the x-axis, and shifted 9 units down.
Background
Topic: Transformations of Radical Functions
This question tests your ability to write equations for transformed functions.
Key Terms and Formulas
Horizontal shift: shifts right by units.
Reflection about x-axis: .
Vertical shift: shifts up/down by units.
Step-by-Step Guidance
Shift right by 7: .
Reflect about the x-axis: .
Shift down by 9: .
Try solving on your own before revealing the answer!
Final Answer:
Each transformation is applied in the correct order.
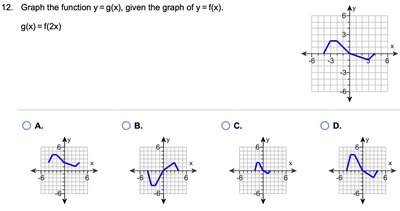
Q12. Graph given the graph of .
Background
Topic: Transformations—Horizontal Compression
This question tests your ability to apply horizontal compression to a function.
Key Terms and Formulas
Horizontal compression: compresses the graph horizontally by a factor of .
Step-by-Step Guidance
For , every -value on the graph of is replaced by .
This means the graph is compressed horizontally by a factor of .
Match the compressed graph to the correct option among the choices.
Try solving on your own before revealing the answer!
Final Answer:
The correct graph is option B.
Horizontal compression by a factor of brings points closer to the y-axis.
