 Back
BackProperties and Graphing of Quadratic Functions
Study Guide - Smart Notes
 Tailored notes based on your materials, expanded with key definitions, examples, and context.
Section 2.4 Properties of Quadratic Functions
Introduction
Quadratic functions are fundamental in precalculus and are characterized by their parabolic graphs. This section explores the properties of quadratic functions, focusing on their graphs, vertices, axes of symmetry, and methods for graphing using transformations and intercepts.
Graphing a Quadratic Function Using Transformations
Parabolas: Basic Properties
A quadratic function is any function of the form , where . The graph of a quadratic function is called a parabola. The direction in which the parabola opens depends on the sign of the coefficient :
If , the parabola opens upward and the vertex is the lowest point (minimum).
If , the parabola opens downward and the vertex is the highest point (maximum).
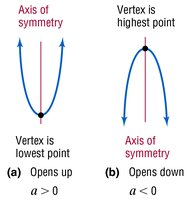
Axis of Symmetry and Vertex
The axis of symmetry is a vertical line that passes through the vertex of the parabola, dividing it into two mirror-image halves. The vertex is the point where the parabola changes direction.

Transformations of Quadratic Functions
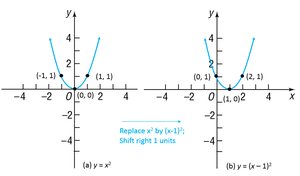
Quadratic functions can be graphed using transformations of the basic function :
Horizontal shift: shifts the graph units right if .
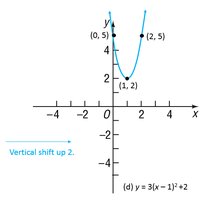
Vertical shift: shifts the graph units up if .
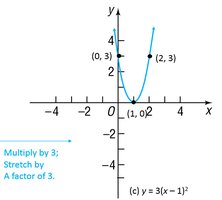
Vertical stretch/compression: stretches the graph by if or compresses it if .
Identifying the Vertex and Axis of Symmetry
Vertex Formula
The vertex of a quadratic function can be found using:
x-coordinate of vertex:
y-coordinate of vertex:
Axis of symmetry:
If , the vertex is a minimum; if , the vertex is a maximum.
Graphing a Quadratic Function Using Its Vertex, Axis, and Intercepts
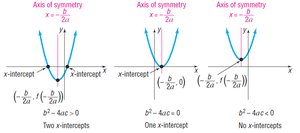
x-Intercepts and the Discriminant
The number of x-intercepts of a quadratic function depends on the discriminant :
If , there are two distinct x-intercepts.
If , there is one x-intercept (the vertex touches the x-axis).
If , there are no real x-intercepts.
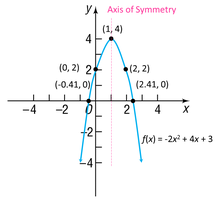
Example: Graphing Using Properties
To graph :
Opens down ()
Vertex: ,
Axis of symmetry:
y-intercept:
x-intercepts: Solve using the quadratic formula
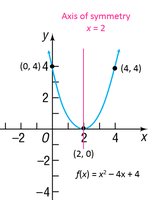
Example: Parabola Touching the x-Axis
For :
Opens up ()
Vertex: ,
Axis of symmetry:
y-intercept:
x-intercept: Vertex lies on the x-axis

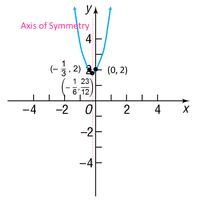
Example: Parabola with No x-Intercepts
For :
Opens up ()
Vertex: ,
Axis of symmetry:
y-intercept:
No real x-intercepts (discriminant )

Finding the Maximum or Minimum Value of a Quadratic Function
Vertex as Maximum or Minimum
The vertex of a quadratic function gives the maximum or minimum value of the function:
If , the minimum value is at the vertex.
If , the maximum value is at the vertex.
The value occurs at , and the maximum or minimum is .
Summary: Steps for Graphing a Quadratic Function
Write the quadratic function in vertex form by completing the square, or use standard form.
Determine if the parabola opens up () or down ().
Find the vertex using and .
Find the axis of symmetry ().
Find the y-intercept () and x-intercepts (solve ).
Plot the vertex, intercepts, and an additional point using symmetry.
Draw the parabola through these points.
