 Back
BackProperties of Functions: Even/Odd, Increasing/Decreasing, Maxima and Minima
Study Guide - Smart Notes
 Tailored notes based on your materials, expanded with key definitions, examples, and context.
Properties of Functions
Even and Odd Functions
Understanding whether a function is even, odd, or neither is fundamental in precalculus. These properties are determined by the function's symmetry and algebraic behavior.
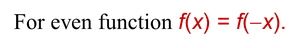
Even Function: A function f is even if for every x in its domain, f(-x) = f(x). The graph of an even function is symmetric with respect to the y-axis.
Odd Function: A function f is odd if for every x in its domain, f(-x) = -f(x). The graph of an odd function is symmetric with respect to the origin.
Example: The function f(x) = x^2 is even, while f(x) = x^3 is odd.
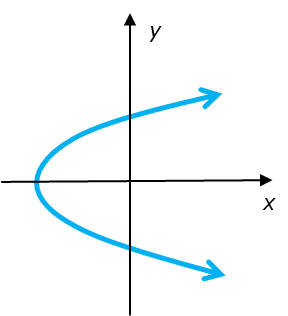
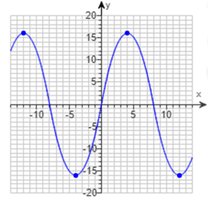
Identifying Even and Odd Functions from a Graph
To determine if a function is even or odd from its graph, observe the symmetry:
Y-axis symmetry: Indicates an even function.
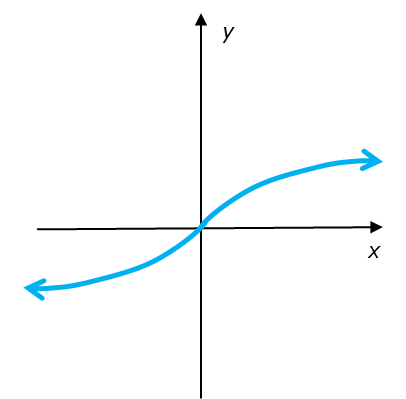
Origin symmetry: Indicates an odd function.


Identifying Even and Odd Functions from an Equation
To check algebraically:
Substitute -x for x in the function.
If f(-x) = f(x), the function is even.
If f(-x) = -f(x), the function is odd.


Increasing, Decreasing, and Constant Functions
Definition of Increasing Function
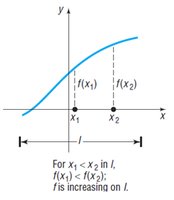
A function f is increasing on an interval I if for any two numbers x_1 and x_2 in I with x_1 < x_2, we have f(x_1) < f(x_2).
Key Point: The graph rises as you move from left to right.
Definition of Decreasing Function
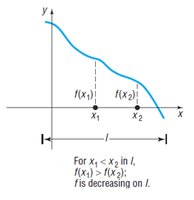
A function f is decreasing on an interval I if for any two numbers x_1 and x_2 in I with x_1 < x_2, we have f(x_1) > f(x_2).
Key Point: The graph falls as you move from left to right.
Local and Absolute Extrema
Local Maximum and Minimum
A function f has a local maximum at c if f(c) is greater than or equal to f(x) for all x near c. It has a local minimum at c if f(c) is less than or equal to f(x) for all x near c.
Local Maximum: Highest point in a neighborhood.
Local Minimum: Lowest point in a neighborhood.

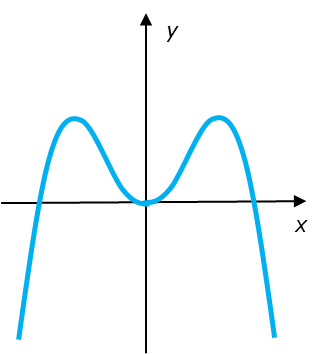
Example: Finding Local Extrema
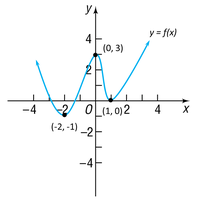
Given a graph, identify the x-values where the function attains local maxima and minima, and list their values.
Local Maximum: At x = 0, f(0) = 3.
Local Minima: At x = -2 and x = 1.
Intervals of Increase and Decrease
To find where a function is increasing or decreasing, examine the graph:
Increasing: Where the graph rises.
Decreasing: Where the graph falls.
Absolute Maximum and Minimum
The absolute maximum of a function is the highest value attained on its domain, and the absolute minimum is the lowest value attained.
Absolute Maximum: For all x in the domain, f(u) >= f(x).
Absolute Minimum: For all x in the domain, f(v) <= f(x).


Practice Examples
Example: Intercepts, Domain, and Range
To find intercepts, domain, and range:
Intercepts: Points where the graph crosses the axes.
Domain: All possible input values (x-values).
Range: All possible output values (y-values).


Summary Table: Properties of Functions
Property | Definition | Graphical Symmetry |
|---|---|---|
Even | Y-axis | |
Odd | Origin | |
Increasing | for | Rises left to right |
Decreasing | for | Falls left to right |
Local Maximum | Highest value in neighborhood | Peak |
Local Minimum | Lowest value in neighborhood | Valley |
Absolute Maximum | Highest value on domain | Highest point |
Absolute Minimum | Lowest value on domain | Lowest point |
Additional info: All explanations have been expanded for clarity and completeness, and images included are directly relevant to the adjacent content.
