 Back
BackQuadratic Functions and Their Graphs: Vertex, Axis of Symmetry, and Applications
Study Guide - Smart Notes
 Tailored notes based on your materials, expanded with key definitions, examples, and context.
Quadratic Functions and Equations
Analyzing Graphs of Quadratic Functions
Quadratic functions are fundamental in precalculus, and their graphs are called parabolas. Understanding the properties of parabolas, such as the vertex, axis of symmetry, and maximum or minimum values, is essential for solving equations and modeling real-world scenarios.
Vertex: The point where the parabola changes direction. It represents the maximum or minimum value of the function.
Axis of Symmetry: A vertical line that divides the parabola into two mirror-image halves. Its equation is x = h for a parabola in the form f(x) = a(x - h)^2 + k.
Maximum/Minimum Value: Occurs at the vertex. If a > 0, the parabola opens upward and the vertex is a minimum. If a < 0, it opens downward and the vertex is a maximum.
Completing the square is a method used to rewrite quadratic functions in vertex form, making it easier to identify the vertex and axis of symmetry.
Graphing Quadratic Functions
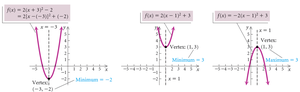
Quadratic functions can be graphed using their vertex form f(x) = a(x - h)^2 + k. The graph is a parabola with vertex at (h, k) and axis of symmetry x = h. The value of a determines the direction and width of the parabola.
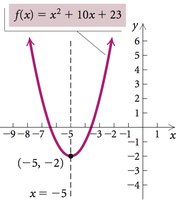
Example: For f(x) = x^2 + 10x + 23, completing the square gives the vertex at (-5, -2) and axis of symmetry x = -5. The minimum value is -2.
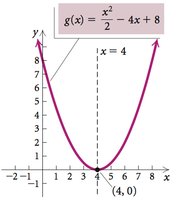
Example: For g(x) = \frac{x^2}{2} - 4x + 8, the vertex is at (4, 0) and axis of symmetry x = 4. The minimum value is 0. This graph is a vertical shrinking and a shift to the right compared to f(x) = x^2.
Vertex of a Parabola
The vertex of a parabola given by f(x) = ax^2 + bx + c can be found using the formula:
x-coordinate:
y-coordinate: Substitute x into the function:
The vertex is (x, y). The sign of a determines whether the vertex is a maximum or minimum.
Example: Analyzing a Quadratic Function
Given f(x) = -2(x - 7)^2 + 2:
Vertex: (7, 2)
Maximum/Minimum: Since a = -2 (negative), the graph opens downward and the vertex is a maximum.
Range:
Intervals: The function is increasing on and decreasing on .
Applications of Quadratic Functions
Maximizing Area: Real-World Example
Quadratic functions are used to solve optimization problems, such as maximizing the area of a rectangular enclosure with a fixed perimeter. In this example, a landscaper uses 24 ft of stone wall to enclose a pond next to a garden wall, which forms one side of the rectangle.
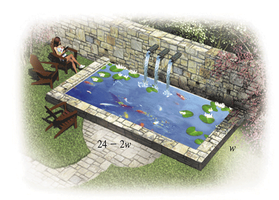
Let w: width of the pond (ft)
Length: (since the garden wall forms one side)
Area:
Maximum Area: Occurs at the vertex of the parabola. The maximum is at ft, so length is ft.
Maximum possible area: ft2
Thus, the maximum area is 72 ft2 when the pond is 6 feet wide and 12 feet long.
Summary Table: Properties of Quadratic Functions
Property | Description |
|---|---|
Vertex | Point (h, k) where the parabola turns |
Axis of Symmetry | Vertical line x = h |
Maximum/Minimum | Occurs at the vertex; minimum if a > 0, maximum if a < 0 |
Range | Depends on direction: [k, ∞) for minimum, (−∞, k] for maximum |
Intervals | Increasing to vertex, decreasing after vertex (or vice versa) |
