 Back
BackQuadratic, Polynomial, and Rational Functions: Properties, Graphs, and Applications
Study Guide - Smart Notes
 Tailored notes based on your materials, expanded with key definitions, examples, and context.
Quadratic Functions and Their Properties
Definition of a Quadratic Function
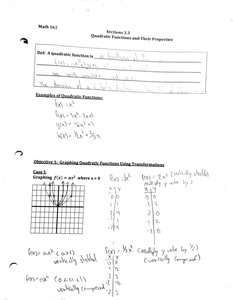
A quadratic function is a function of the form , where , , and are real numbers. The graph of a quadratic function is called a parabola.
Standard form:
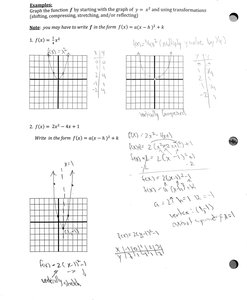
Vertex form:
Examples: , ,
Graphing Quadratic Functions Using Transformations
Quadratic functions can be graphed by applying transformations to the basic graph . Transformations include shifting, stretching, compressing, and reflecting.
Vertical shift: shifts the graph up/down by units.
Horizontal shift: shifts the graph right/left by units.
Vertical stretch/compression: stretches if , compresses if .
Reflection: reflects the graph across the x-axis.
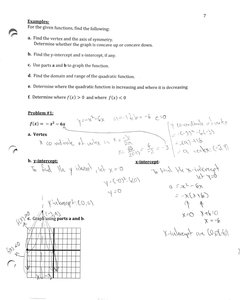
Properties of Quadratic Functions
Key properties include the vertex, axis of symmetry, direction of opening, domain, and range.
Vertex: The point in .
Axis of symmetry: .
Direction: Opens up if , down if .
Domain:
Range: if , if .
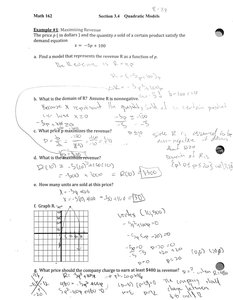
Applications of Quadratic Functions
Quadratic functions are used in modeling revenue, area, and optimization problems.
Maximizing revenue: Revenue functions often take quadratic form, and the maximum occurs at the vertex.
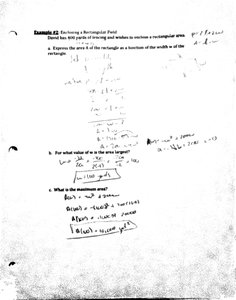
Enclosing areas: Quadratic expressions can model area as a function of a variable.
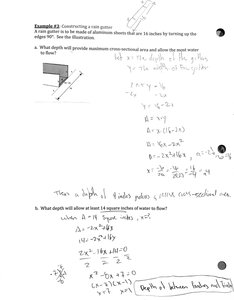
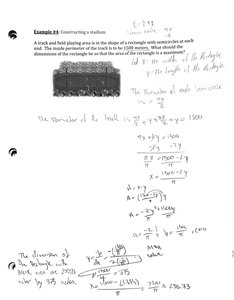
Constructing objects: Optimization of cross-sectional area or perimeter can be solved using quadratic functions.
Polynomial Functions
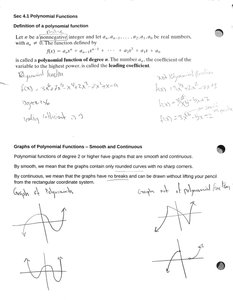
Definition of a Polynomial Function
A polynomial function of degree is defined as , where and $n$ is a nonnegative integer.
Degree: The highest power of .
Leading coefficient: .
Graphs of Polynomial Functions
Polynomial functions of degree 2 or higher have graphs that are smooth and continuous, with no breaks or sharp corners.
End behavior: Determined by the degree and leading coefficient.
Turning points: A polynomial of degree has at most turning points.
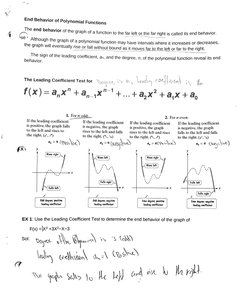
End Behavior of Polynomial Functions
The end behavior describes how the graph behaves as . The Leading Coefficient Test helps determine this:
If is even and , both ends rise.
If is even and , both ends fall.
If is odd and , left end falls, right end rises.
If is odd and , left end rises, right end falls.
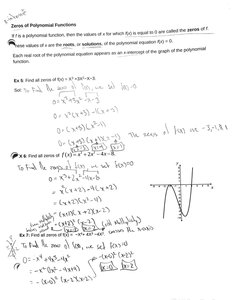
Zeros of Polynomial Functions
The zeros of a polynomial function are the values of for which . These are also called x-intercepts or roots.
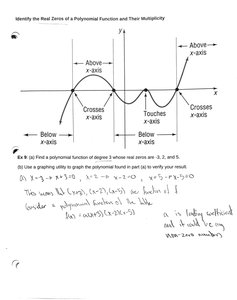
Multiplicity: If a zero has even multiplicity, the graph touches and turns at the x-axis. If odd, it crosses the axis.
Finding zeros: Factor the polynomial and solve for .
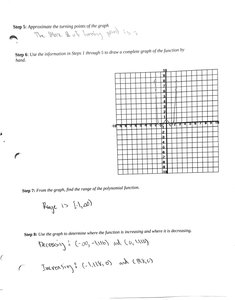
Graphing Polynomial Functions Using x-Intercepts
To graph a polynomial, plot the x-intercepts, y-intercept, and other points, then connect with a smooth curve.
Identify intervals where the graph is above or below the x-axis.
Use turning points and symmetry to aid graphing.
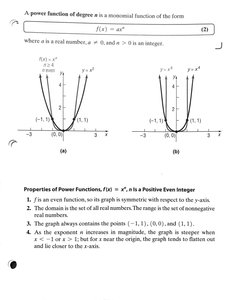
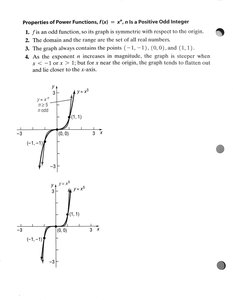
Power Functions
A power function is of the form , where is a real number and is a positive integer.
If is even, the graph is symmetric about the y-axis.
If is odd, the graph is symmetric about the origin.
As increases, the graph becomes steeper near the origin and flatter away from it.
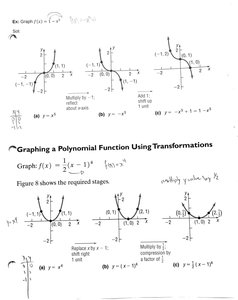
Graphing Polynomial Functions Using Transformations
Transformations can be applied to polynomial functions to shift, stretch, compress, or reflect their graphs.
Replace with for horizontal shifts.
Multiply by for vertical stretch/compression.
Rational Functions and Their Properties
Definition of Rational Functions
A rational function is a quotient of two polynomial functions: , where .
Domain: All real numbers except where .
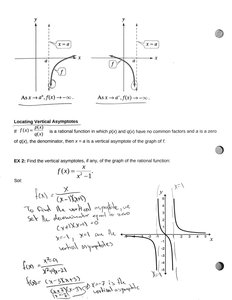
Arrow Notation and Asymptotes
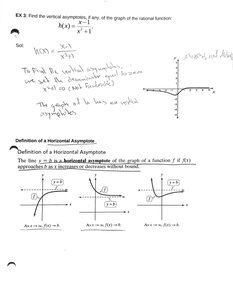
Arrow notation describes the behavior of functions as approaches certain values. Vertical asymptotes occur where the denominator is zero and the numerator is nonzero.
Symbol | Meaning |
|---|---|
x → a⁺ | x approaches a from the right |
x → a⁻ | x approaches a from the left |
x → ∞ | x approaches infinity |
x → -∞ | x approaches negative infinity |
Locating Vertical and Horizontal Asymptotes
Vertical asymptotes are found by setting the denominator equal to zero. Horizontal asymptotes depend on the degrees of the numerator and denominator:
If degree numerator < degree denominator: is the horizontal asymptote.
If degrees are equal: , where and are leading coefficients.
If degree numerator > degree denominator: No horizontal asymptote.

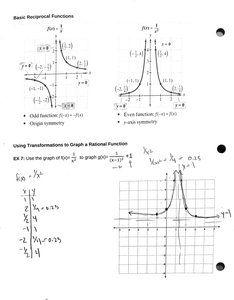
Basic Reciprocal Functions
The reciprocal functions and are important examples of rational functions.
is odd and has origin symmetry.
is even and has y-axis symmetry.
Slant (Oblique) Asymptotes
A rational function has a slant asymptote if the degree of the numerator is one more than the degree of the denominator. The slant asymptote is found by dividing the numerator by the denominator.
Example:
Divide by to find the slant asymptote.
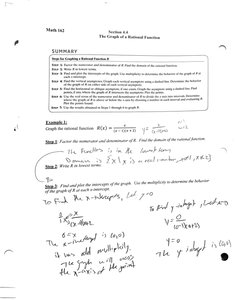
Graphing Rational Functions
To graph a rational function:
Factor numerator and denominator.
Find x- and y-intercepts.
Find and graph vertical, horizontal, and slant asymptotes.
Plot additional points and sketch the graph.
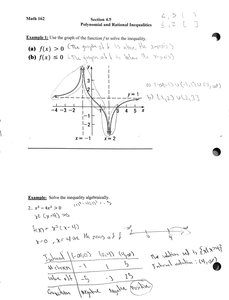
Polynomial and Rational Inequalities
To solve inequalities involving polynomial or rational functions, use the graph or solve algebraically by finding critical points and testing intervals.
Set to find critical points.
Test intervals between critical points.
Write solution in interval notation.
The Real Zeros of a Polynomial Function
Remainder and Factor Theorems
The Remainder Theorem states that the remainder of divided by is . The Factor Theorem states that is a factor of if and only if .
Descartes' Rule of Signs
Descartes' Rule of Signs is used to determine the number of positive and negative real zeros of a polynomial function by counting sign changes in the coefficients.
Number of positive real zeros: Number of sign changes in .
Number of negative real zeros: Number of sign changes in .
Rational Zero Theorem
The Rational Zero Theorem lists all possible rational zeros of a polynomial function. Possible rational zeros are of the form , where divides the constant term and divides the leading coefficient.
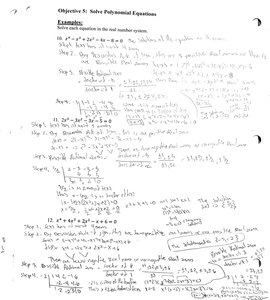
Solving Polynomial Equations
To solve polynomial equations:
List possible rational zeros.
Test each possible zero.
Factor the polynomial.
Find all real zeros.
Additional info: Some context and explanations were expanded for completeness and clarity, including definitions, properties, and step-by-step strategies for graphing and solving equations.
