 Back
BackStudy Guide: Graphs and Properties of Trigonometric Functions (Precalculus)
Study Guide - Smart Notes
 Tailored notes based on your materials, expanded with key definitions, examples, and context.
Graphs and Properties of Trigonometric Functions
Graphing Sine and Cosine Functions
The sine and cosine functions are fundamental periodic functions in trigonometry. Their general forms are:
Sine:
Cosine:
Key properties:
Amplitude: (the maximum displacement from the midline)
Period: (the length of one complete cycle)
Phase Shift: (horizontal shift of the graph)
Vertical Shift: (moves the graph up or down)
x-coordinates of quarter points: Start at phase shift, add period 4
y-coordinates of quarter points:
Graphing Tangent Functions
The tangent function has a different periodicity and features vertical asymptotes:
General form:
Period:
Vertical Asymptotes: Occur at the endpoints of the principal cycle
x-coordinates of center, left & right halfway points: Start at left vertical asymptote, add period 4
y-coordinates of center, left & right halfway points:
Tangent values: Left: , Center: $0
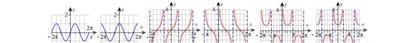
Graphs of Trigonometric Functions
Each trigonometric function has a distinct graph, characterized by its period, amplitude, and symmetry.
Even and Odd Properties of Trigonometric Functions
Trigonometric functions can be classified as even or odd, which affects their symmetry:
Odd Functions: , , ,
Even Functions: ,
Inverse Trigonometric Function Intervals
Inverse trigonometric functions are defined on restricted intervals to ensure they are one-to-one:
: values , angles
: values , angles
: values , angles
Evaluating Inverse Trigonometric Functions
Inverse trigonometric functions return the angle whose trigonometric value is given. Their geometric interpretation is shown below:

Special Values of Trigonometric Functions
Trigonometric functions have well-known values at special angles. These are often summarized in a table:
Angle | 0 | ||||
|---|---|---|---|---|---|
0 | 1 | ||||
1 | 0 | ||||
0 | 1 | undefined |

Example Problems
Example 1: Sketching
Sketch the graph of and identify its properties: amplitude , period , phase shift , vertical shift . The graph is symmetric about the origin (odd function).
Example 2: Using Odd Function Property
Use the fact that is an odd function to determine which expression is equivalent to .
Example 3: Sketching
Sketch the graph of and identify its properties: period , vertical asymptotes at , odd function.
Example 4: Identifying Trigonometric Function from Graph
Given a graph of one cycle of a trigonometric function, determine the equation of the function in the form or .

Example 5: Determining Period and Quarter Points
Determine the period of and sketch its graph. The period is .
Example 6: Amplitude, Range, Period, and Phase Shift
Determine the amplitude, range, period, and phase shift for a given function and sketch the graph using quarter points.
Example 7: Tangent Function Principal Cycle
For a tangent function, determine the interval for the principal cycle, period, equations of vertical asymptotes, and coordinates of center and halfway points. Sketch the graph.
Example 8: Range of a Sine Function
Determine the range of . The range is .
Example 9: Exact Values of Trigonometric Expressions
Find the exact value of trigonometric expressions at special angles using the table above.
Summary Table: Trigonometric Function Properties
Function | Amplitude | Period | Phase Shift | Vertical Shift | Even/Odd |
|---|---|---|---|---|---|
Odd | |||||
Even | |||||
N/A | Odd |
Additional info: Academic context and explanations have been expanded for clarity and completeness. Only directly relevant images and tables have been included to reinforce the study material.
