 Back
BackThe Graphs of Sine and Cosine Functions
Study Guide - Smart Notes
 Tailored notes based on your materials, expanded with key definitions, examples, and context.
The Graphs of Sine and Cosine
Understanding the Graph of the Sine Function and its Properties
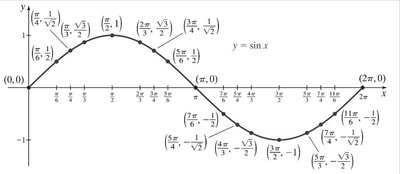
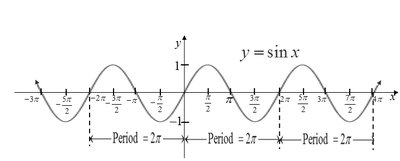
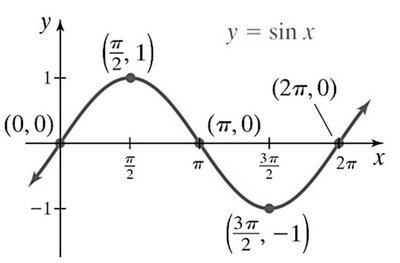
The sine function, y = \sin x, is a fundamental trigonometric function whose graph is a smooth, continuous wave. The x-values represent angles measured in radians, and the y-values are the sine of those angles. The graph is periodic, meaning it repeats its pattern over regular intervals.
Domain:
Range:
Periodicity: The function repeats every units: for any integer .
Y-intercept: at
X-intercepts (zeros): , where is any integer
Odd Function: (symmetric about the origin)
Relative Maximum: at
Relative Minimum: at
Understanding the Graph of the Cosine Function and its Properties
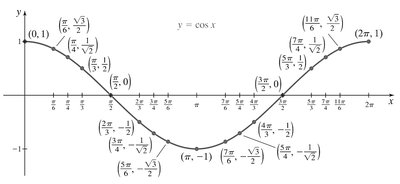
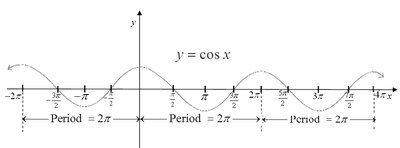
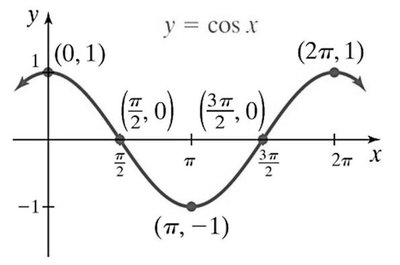
The cosine function, y = \cos x, is another fundamental trigonometric function. Like the sine function, its graph is a smooth, continuous wave, but it starts at its maximum value when .
Domain:
Range:
Periodicity: The function repeats every units: for any integer .
Y-intercept: at
X-intercepts (zeros): , where is any integer
Even Function: (symmetric about the y-axis)
Relative Maximum: at
Relative Minimum: at
The Five Quarter Points of Sine and Cosine
When sketching one complete cycle of the sine or cosine function, five key points (quarter points) are used to divide the cycle into four equal parts. These points help in accurately drawing the graph.
Sine Quarter Points: , , , ,
Cosine Quarter Points: , , , ,
Sketching Functions of the Form and
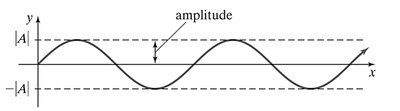
The amplitude of a sine or cosine curve is half the distance between its maximum and minimum values. For or , the amplitude is , and the range is .
Amplitude:
Range:
Sketching Functions of the Form and
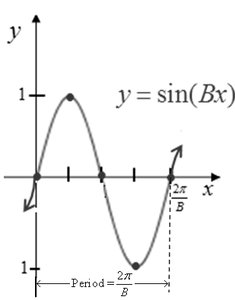
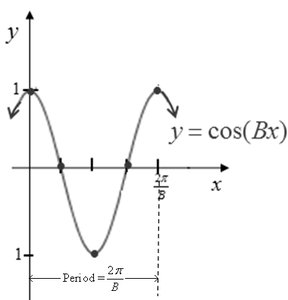
The period of or is determined by the value of . The period is the length of one complete cycle and is given by , where .
Period:
Sketching Functions of the Form and
To sketch these functions, follow these steps:
If , rewrite the function using the even/odd properties so that .
Determine the amplitude () and range ().
Determine the period ().
Divide one period into four equal subintervals (quarter points).
Multiply the y-coordinates of the standard quarter points by .
Connect the quarter points to complete one cycle.
Determining the Equation of a Function of the Form or Given Its Graph
To find the equation from a graph:
Decide if the graph is a sine or cosine function (sine passes through the origin, cosine does not).
Determine the period from the graph, then solve for using .
Use a known point to solve for .
Example: If a graph passes through the origin and has a period of , then . If the maximum is 3, then , so the equation is .
