Explain how to perform a two-sample t-test for the difference between two population means.
Table of contents
- 1. Intro to Stats and Collecting Data1h 14m
- 2. Describing Data with Tables and Graphs1h 56m
- 3. Describing Data Numerically2h 5m
- 4. Probability2h 16m
- 5. Binomial Distribution & Discrete Random Variables3h 6m
- 6. Normal Distribution and Continuous Random Variables2h 11m
- 7. Sampling Distributions & Confidence Intervals: Mean3h 23m
- Sampling Distribution of the Sample Mean and Central Limit Theorem19m
- Distribution of Sample Mean - Excel23m
- Introduction to Confidence Intervals15m
- Confidence Intervals for Population Mean1h 18m
- Determining the Minimum Sample Size Required12m
- Finding Probabilities and T Critical Values - Excel28m
- Confidence Intervals for Population Means - Excel25m
- 8. Sampling Distributions & Confidence Intervals: Proportion2h 10m
- 9. Hypothesis Testing for One Sample5h 8m
- Steps in Hypothesis Testing1h 6m
- Performing Hypothesis Tests: Means1h 4m
- Hypothesis Testing: Means - Excel42m
- Performing Hypothesis Tests: Proportions37m
- Hypothesis Testing: Proportions - Excel27m
- Performing Hypothesis Tests: Variance12m
- Critical Values and Rejection Regions28m
- Link Between Confidence Intervals and Hypothesis Testing12m
- Type I & Type II Errors16m
- 10. Hypothesis Testing for Two Samples5h 37m
- Two Proportions1h 13m
- Two Proportions Hypothesis Test - Excel28m
- Two Means - Unknown, Unequal Variance1h 3m
- Two Means - Unknown Variances Hypothesis Test - Excel12m
- Two Means - Unknown, Equal Variance15m
- Two Means - Unknown, Equal Variances Hypothesis Test - Excel9m
- Two Means - Known Variance12m
- Two Means - Sigma Known Hypothesis Test - Excel21m
- Two Means - Matched Pairs (Dependent Samples)42m
- Matched Pairs Hypothesis Test - Excel12m
- Two Variances and F Distribution29m
- Two Variances - Graphing Calculator16m
- 11. Correlation1h 24m
- 12. Regression3h 33m
- Linear Regression & Least Squares Method26m
- Residuals12m
- Coefficient of Determination12m
- Regression Line Equation and Coefficient of Determination - Excel8m
- Finding Residuals and Creating Residual Plots - Excel11m
- Inferences for Slope31m
- Enabling Data Analysis Toolpak1m
- Regression Readout of the Data Analysis Toolpak - Excel21m
- Prediction Intervals13m
- Prediction Intervals - Excel19m
- Multiple Regression - Excel29m
- Quadratic Regression15m
- Quadratic Regression - Excel10m
- 13. Chi-Square Tests & Goodness of Fit2h 21m
- 14. ANOVA2h 28m
10. Hypothesis Testing for Two Samples
Two Means - Unknown, Unequal Variance
Problem 11.RS.2a
Textbook Question
In a recent year, according to the Bureau of Labor Statistics, the median number of years that wage and salary employees had been with their current employer (called employee tenure) was 4.1 years. Information on employee tenure has been gathered since 1996 using the Current Population Survey (CPS), a monthly survey of about 60,000 households that provides information on employment, unemployment, earnings, demographics, and other characteristics of the U.S. population ages 16 and over. With respect to employee tenure, the questions measure how long employees have been with their current employers, not how long they plan to stay with their employers.
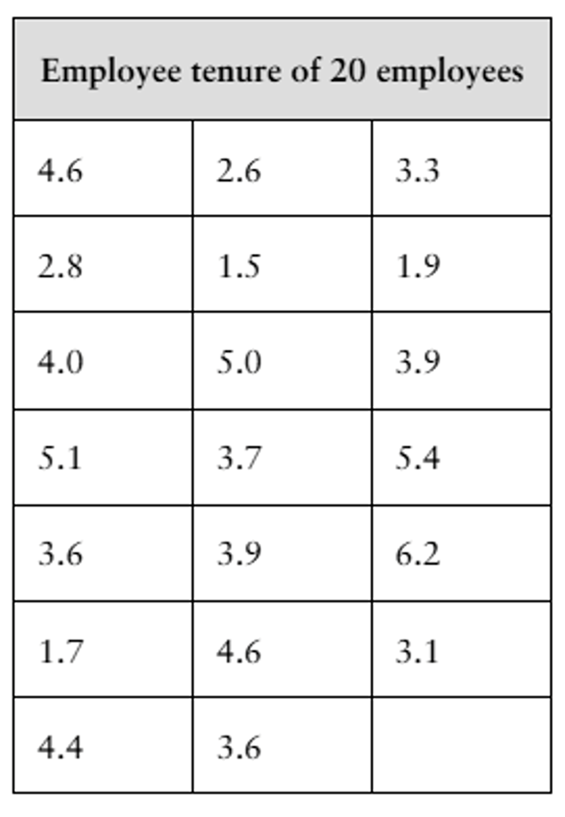
A congressional representative claims that the median tenure for employees from the representative’s district is less than the national median tenure of 4.1 years. The claim is based on the representative’s data, which is shown in the table at the right above. (Assume that the employees were randomly selected.)

a. Is it possible that the claim is true? What questions should you ask about how the data were collected?
 Verified step by step guidance
1
Step 1: Organize the data provided in the table into a sorted list to facilitate calculation of the median. Sorting the data helps identify the middle value(s) in the dataset.
Step 2: Calculate the median of the employee tenure data for the representative's district. Since there are 20 data points (even number), the median is the average of the 10th and 11th values in the sorted list.
Step 3: Compare the calculated median of the district's employee tenure data to the national median of 4.1 years. If the district's median is less than 4.1 years, the claim may be supported.
Step 4: Evaluate the representativeness of the sample. Ask questions such as: Were the employees randomly selected? Does the sample size (20 employees) adequately represent the district's population? Are there any biases in the data collection process?
Step 5: Consider statistical significance. If the district's median is less than 4.1 years, conduct a hypothesis test (e.g., one-sample median test) to determine if the difference is statistically significant or could have occurred by chance.
 Verified video answer for a similar problem:
This video solution was recommended by our tutors as helpful for the problem above
Video duration:
4mPlay a video:
0 Comments
Key Concepts
Here are the essential concepts you must grasp in order to answer the question correctly.
Median
The median is a measure of central tendency that represents the middle value in a data set when it is ordered from least to greatest. In the context of employee tenure, the median tenure of 4.1 years indicates that half of the employees have tenures shorter than this value, and half have longer tenures. It is particularly useful for skewed distributions, as it is less affected by extreme values than the mean.
Recommended video:
Guided course

Calculating the Median
Random Sampling
Random sampling is a technique used to select a subset of individuals from a larger population, ensuring that each individual has an equal chance of being chosen. This method is crucial for obtaining unbiased data that accurately reflects the characteristics of the entire population. In this scenario, the claim about the median tenure in the congressional representative's district relies on the assumption that the sampled employees were randomly selected.
Recommended video:

Simple Random Sampling
Hypothesis Testing
Hypothesis testing is a statistical method used to determine whether there is enough evidence to reject a null hypothesis in favor of an alternative hypothesis. In this case, the null hypothesis would state that the median tenure in the representative's district is equal to or greater than 4.1 years, while the alternative hypothesis would claim it is less. The validity of the representative's claim hinges on the analysis of the sample data against these hypotheses.
Recommended video:

Performing Hypothesis Tests: Proportions

 8:24m
8:24mWatch next
Master Difference in Means: Hypothesis Tests with a bite sized video explanation from Patrick
Start learningRelated Videos
Related Practice
Textbook Question
118
views
