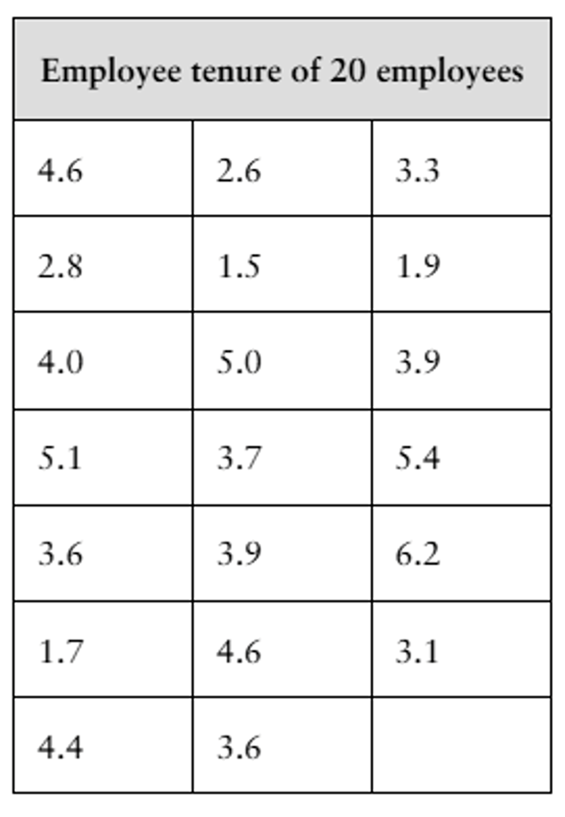
In a recent year, according to the Bureau of Labor Statistics, the median number of years that wage and salary employees had been with their current employer (called employee tenure) was 4.1 years. Information on employee tenure has been gathered since 1996 using the Current Population Survey (CPS), a monthly survey of about 60,000 households that provides information on employment, unemployment, earnings, demographics, and other characteristics of the U.S. population ages 16 and over. With respect to employee tenure, the questions measure how long employees have been with their current employers, not how long they plan to stay with their employers. A congressional representative claims that the median tenure for employees from the representative’s district is less than the national median tenure of 4.1 years. The claim is based on the representative’s data, which is shown in the table at the right above. (Assume that the employees were randomly selected.) c. State the null hypothesis and the alternative hypothesis.
Verified step by step guidance
1
Step 1: Understand the context of the problem. The congressional representative claims that the median tenure for employees in their district is less than the national median tenure of 4.1 years. This is a hypothesis testing problem where we need to define the null and alternative hypotheses.
Step 2: Define the null hypothesis (H₀). The null hypothesis represents the status quo or no effect. In this case, H₀: The median tenure for employees in the representative’s district is equal to or greater than the national median tenure of 4.1 years.
Step 3: Define the alternative hypothesis (H₁). The alternative hypothesis represents the claim being tested. In this case, H₁: The median tenure for employees in the representative’s district is less than the national median tenure of 4.1 years.
Step 4: Express the hypotheses mathematically. Using statistical notation: H₀: Median tenure ≥ 4.1 years, H₁: Median tenure < 4.1 years.
Step 5: Note that this is a one-tailed test because the claim specifically states 'less than' the national median tenure. This directionality is important for determining the critical region in hypothesis testing.
Verified video answer for a similar problem:
This video solution was recommended by our tutors as helpful for the problem above
Video duration:
1m
Play a video:
0 Comments
Key Concepts
Here are the essential concepts you must grasp in order to answer the question correctly.
Null Hypothesis (H0)
The null hypothesis is a statement that indicates no effect or no difference, serving as a default position in hypothesis testing. In this context, it posits that the median employee tenure in the congressional representative's district is equal to the national median of 4.1 years. It is denoted as H0: μ = 4.1, where μ represents the median tenure of employees in the district.
The alternative hypothesis is a statement that contradicts the null hypothesis, suggesting that there is an effect or a difference. For this scenario, it claims that the median tenure in the representative's district is less than the national median, expressed as H1: μ < 4.1. This hypothesis is what the representative aims to support with their data.
The median is a measure of central tendency that represents the middle value in a data set when it is ordered from least to greatest. It is particularly useful in skewed distributions, as it is less affected by extreme values than the mean. In this case, the median tenure of 4.1 years provides a benchmark for comparing the tenure of employees in the representative's district.

 Verified step by step guidance
 06:21
06:21