


 08:18
08:18

Textbook Question
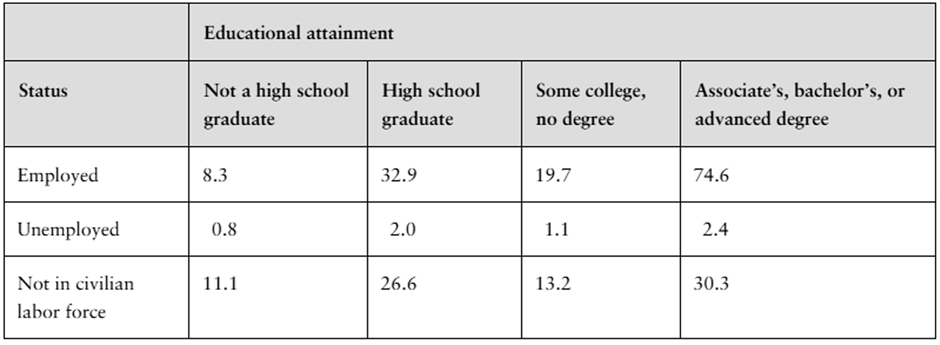
Conditional Relative Frequencies In Exercises 37–42, use the contingency table from Exercises 33–36, and the information below.
Relative frequencies can also be calculated based on the row totals (by dividing each row entry by the row’s total) or the column totals (by dividing each column entry by the column’s total). These frequencies are conditional relative frequencies and can be used to determine whether an association exists between two categories in a contingency table.
What percent of U.S. adults ages 25 and over who are not high school graduates are unemployed?
80
views