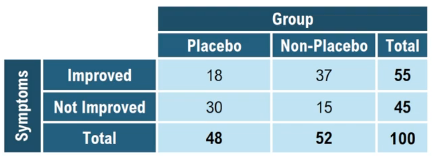
Consider the following contingency table, which relates the number of applicants accepted to a college and gender.
a. Construct a conditional distribution of acceptance status by gender.

E1,1 = 25.0; E2,1 = 25.0; E1,2 = 25.0; E2,2 = 25.0
E1,1 = 28.6; E2,1 = 26.4; E1,2 = 23.4; E2,2 = 21.6
E1,1 = 26.4; E2,1 = 21.6; E1,2 = 28.6; E2,2 = 23.4
E1,1 = 18; E2,1 = 30; E1,2 = 37; E2,2 = 15
 Verified step by step guidance
 8:18m
8:18mMaster Contingency Tables & Expected Frequencies with a bite sized video explanation from Patrick
Start learning
