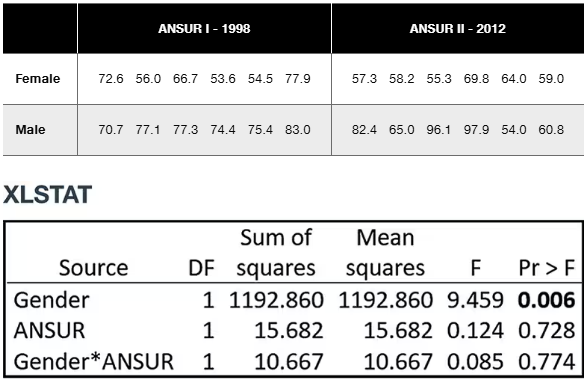
Weights from ANSUR I and ANSUR II The following table lists weights (kg) of randomly selected U.S. Army personnel obtained from the ANSUR I study conducted in 1988 and the ANSUR II study conducted in 2012. If we use the data with two-way analysis of variance and a 0.05 significance level, we get the accompanying display. What do you conclude?
Verified step by step guidance
1
Step 1: Identify the factors and levels in the two-way ANOVA. Here, the two factors are Gender (with levels Female and Male) and ANSUR Study (with levels 1998 and 2012). The response variable is the weight in kilograms.
Step 2: Examine the ANOVA table provided. The table shows degrees of freedom (DF), sum of squares, mean squares, F-statistics, and p-values (Pr > F) for each source of variation: Gender, ANSUR study, and their interaction (Gender*ANSUR).
Step 3: Interpret the p-values to determine statistical significance at the 0.05 significance level. For Gender, the p-value is 0.006, which is less than 0.05, indicating a significant effect of Gender on weight. For ANSUR study, the p-value is 0.728, which is greater than 0.05, indicating no significant effect of the study year on weight. For the interaction Gender*ANSUR, the p-value is 0.774, also greater than 0.05, indicating no significant interaction effect.
Step 4: Conclude that there is a statistically significant difference in weights between genders, but no significant difference between the two ANSUR studies (1998 vs 2012), and no significant interaction between Gender and ANSUR study.
Step 5: Summarize the findings by stating that weight differences are primarily explained by Gender, and the year of the ANSUR study does not significantly affect the weights measured.
Verified video answer for a similar problem:
This video solution was recommended by our tutors as helpful for the problem above
Video duration:
4m
Play a video:
0 Comments
Key Concepts
Here are the essential concepts you must grasp in order to answer the question correctly.
Two-Way Analysis of Variance (ANOVA)
Two-way ANOVA is a statistical method used to examine the effect of two independent categorical variables on a continuous dependent variable. It also tests for interaction effects between the two factors, helping to determine if the effect of one factor depends on the level of the other.
The F-statistic measures the ratio of variance explained by the model to the unexplained variance. The p-value indicates the probability of observing the data if the null hypothesis is true. A p-value less than the significance level (e.g., 0.05) suggests rejecting the null hypothesis, indicating a significant effect.
An interaction effect occurs when the effect of one independent variable on the dependent variable differs depending on the level of the other independent variable. In two-way ANOVA, testing the interaction helps understand if the combined factors influence the outcome differently than each factor alone.