
Textbook Question
In Exercises 13–16, find the critical F-value for a two-tailed test using the level of significance α and degrees of freedom d.f.N and d.f.D.
α=0.01,d.f.N=40,d.f.D=60
51
views
 Verified step by step guidanceVerified video answer for a similar problem:
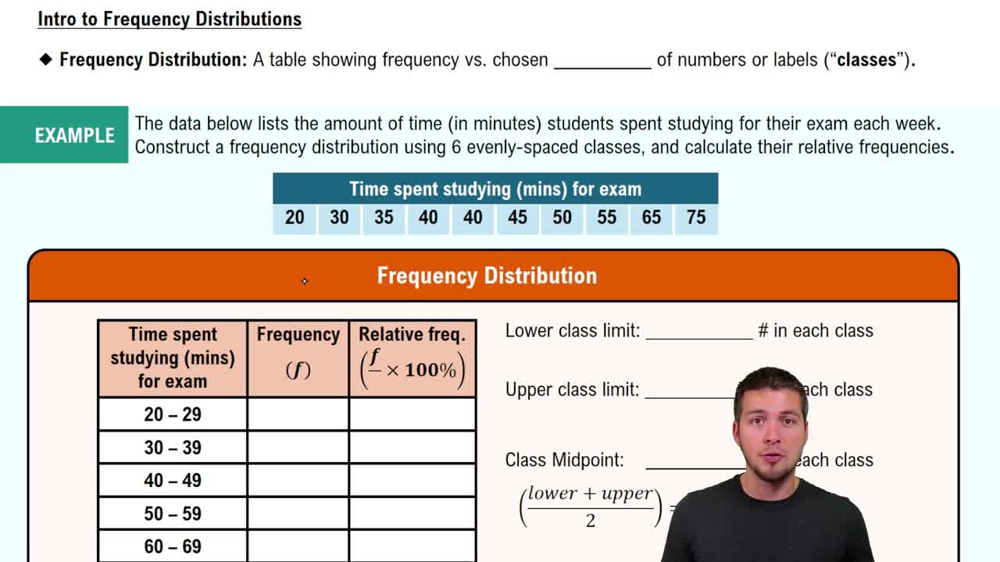
 06:38
06:38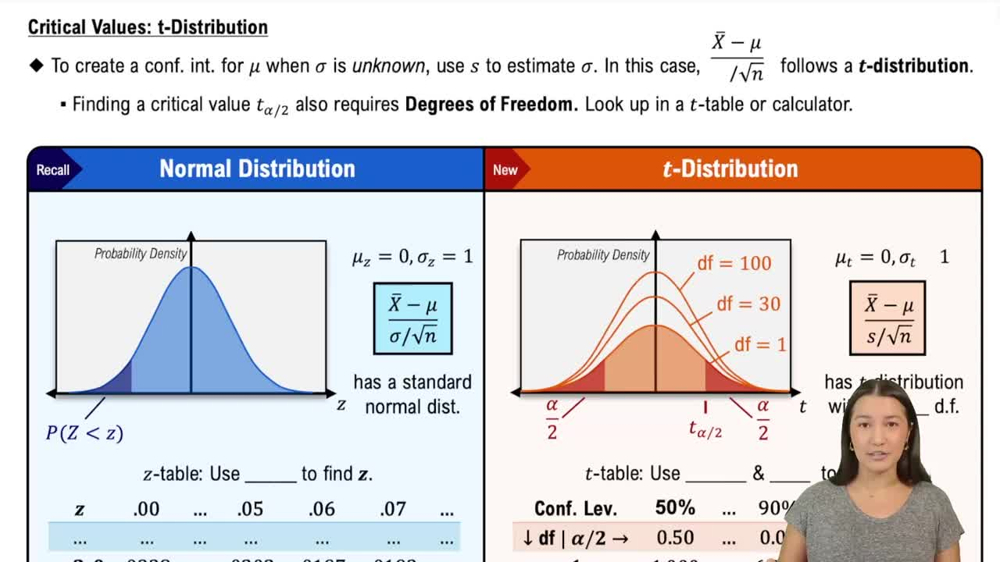 05:50 05:50