Matching In Exercises 17–20, match the level of confidence c with the appropriate confidence interval. Assume each confidence interval is constructed for the same sample statistics. c = 0.88
Verified step by step guidance
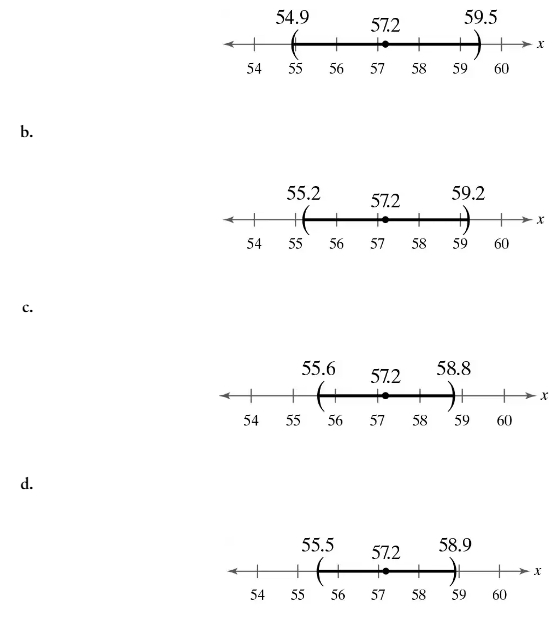
1
Step 1: Understand the concept of confidence intervals. A confidence interval provides a range of values that is likely to contain the population parameter (e.g., mean) with a certain level of confidence. Higher confidence levels result in wider intervals, while lower confidence levels result in narrower intervals.
Step 2: Analyze the given confidence intervals in the images. Each interval is centered around the same sample statistic (57.2), but the width of the intervals varies. Wider intervals correspond to higher confidence levels, and narrower intervals correspond to lower confidence levels.
Step 3: Recall that the confidence level c = 0.88 is relatively low compared to common levels like 0.95 or 0.99. Therefore, the interval associated with c = 0.88 should be narrower than those for higher confidence levels.
Step 4: Compare the intervals in the images. The interval in option 'c' (55.6 to 58.8) is narrower than the intervals in options 'a' and 'b', but slightly wider than the interval in option 'd'. This suggests that option 'c' is likely to correspond to c = 0.88.
Step 5: Match the confidence level c = 0.88 with the appropriate interval. Based on the analysis, the interval in option 'c' (55.6 to 58.8) is the best match for c = 0.88.
Verified video answer for a similar problem:
This video solution was recommended by our tutors as helpful for the problem above
Video duration:
2m
Play a video:
0 Comments
Key Concepts
Here are the essential concepts you must grasp in order to answer the question correctly.
Confidence Interval
A confidence interval is a range of values derived from sample statistics that is likely to contain the true population parameter. It is expressed as an interval estimate, typically calculated using the sample mean and a margin of error, which is influenced by the desired confidence level. For example, a 95% confidence interval suggests that if we were to take many samples, approximately 95% of the calculated intervals would contain the true mean.
The confidence level, denoted as 'c', represents the probability that the confidence interval will contain the true population parameter. Common confidence levels include 90%, 95%, and 99%. A higher confidence level results in a wider interval, reflecting greater uncertainty about the exact value of the parameter. In this case, a confidence level of 0.88 indicates that we expect the true mean to fall within the interval 88% of the time.
The margin of error is the amount of error that is allowed in the estimation of a population parameter. It is calculated based on the standard error of the sample and the critical value associated with the desired confidence level. A larger margin of error results in a wider confidence interval, which can provide more assurance that the interval captures the true parameter, but may also reduce the precision of the estimate.

 Verified step by step guidance
 06:33
06:33