A marketing associate for a supermarket chain wants to determine how many of each snack type to stock. According to previous market research, customers' preferences tend to follow the distribution in the table. If approximately 200 snack items are purchased in a day, what is the expected frequency of each snack type?
Table of contents
- 1. Intro to Stats and Collecting Data1h 14m
- 2. Describing Data with Tables and Graphs1h 55m
- 3. Describing Data Numerically2h 5m
- 4. Probability2h 16m
- 5. Binomial Distribution & Discrete Random Variables3h 6m
- 6. Normal Distribution and Continuous Random Variables2h 11m
- 7. Sampling Distributions & Confidence Intervals: Mean3h 23m
- Sampling Distribution of the Sample Mean and Central Limit Theorem19m
- Distribution of Sample Mean - Excel23m
- Introduction to Confidence Intervals15m
- Confidence Intervals for Population Mean1h 18m
- Determining the Minimum Sample Size Required12m
- Finding Probabilities and T Critical Values - Excel28m
- Confidence Intervals for Population Means - Excel25m
- 8. Sampling Distributions & Confidence Intervals: Proportion2h 10m
- 9. Hypothesis Testing for One Sample5h 8m
- Steps in Hypothesis Testing1h 6m
- Performing Hypothesis Tests: Means1h 4m
- Hypothesis Testing: Means - Excel42m
- Performing Hypothesis Tests: Proportions37m
- Hypothesis Testing: Proportions - Excel27m
- Performing Hypothesis Tests: Variance12m
- Critical Values and Rejection Regions28m
- Link Between Confidence Intervals and Hypothesis Testing12m
- Type I & Type II Errors16m
- 10. Hypothesis Testing for Two Samples5h 37m
- Two Proportions1h 13m
- Two Proportions Hypothesis Test - Excel28m
- Two Means - Unknown, Unequal Variance1h 3m
- Two Means - Unknown Variances Hypothesis Test - Excel12m
- Two Means - Unknown, Equal Variance15m
- Two Means - Unknown, Equal Variances Hypothesis Test - Excel9m
- Two Means - Known Variance12m
- Two Means - Sigma Known Hypothesis Test - Excel21m
- Two Means - Matched Pairs (Dependent Samples)42m
- Matched Pairs Hypothesis Test - Excel12m
- Two Variances and F Distribution29m
- Two Variances - Graphing Calculator16m
- 11. Correlation1h 24m
- 12. Regression3h 33m
- Linear Regression & Least Squares Method26m
- Residuals12m
- Coefficient of Determination12m
- Regression Line Equation and Coefficient of Determination - Excel8m
- Finding Residuals and Creating Residual Plots - Excel11m
- Inferences for Slope31m
- Enabling Data Analysis Toolpak1m
- Regression Readout of the Data Analysis Toolpak - Excel21m
- Prediction Intervals13m
- Prediction Intervals - Excel19m
- Multiple Regression - Excel29m
- Quadratic Regression15m
- Quadratic Regression - Excel10m
- 13. Chi-Square Tests & Goodness of Fit2h 21m
- 14. ANOVA2h 28m
13. Chi-Square Tests & Goodness of Fit
Goodness of Fit Test
Problem 10.1.8
Textbook Question
Performing a Chi-Square Goodness-of-Fit Test
In Exercises 7–16, (a) identify the claim and state H₀ and Hₐ, (b) find the critical value and identify the rejection region, (c) find the chi-square test statistic, (d) decide whether to reject or fail to reject the null hypothesis, and (e) interpret the decision in the context of the original claim.
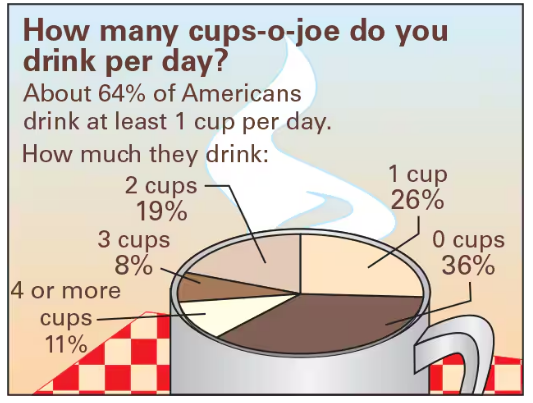
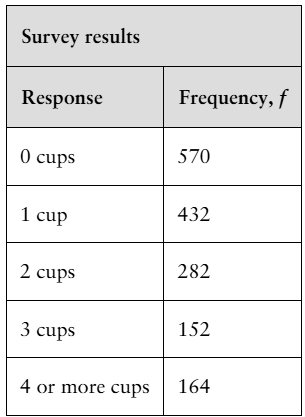
Coffee A researcher claims that the numbers of cups of coffee U.S. adults drink per day are distributed as shown in the figure. You randomly select 1600 U.S. adults and ask them how many cups of coffee they drink per day. The table shows the results. At α=0.05, test the researcher’s claim. (Adapted from Gallup)


 Verified step by step guidance
1
Step 1: Identify the claim and state the null hypothesis (H₀) and alternative hypothesis (Hₐ). The claim is that the distribution of the number of cups of coffee U.S. adults drink per day matches the given percentages: 0 cups (36%), 1 cup (26%), 2 cups (19%), 3 cups (8%), and 4 or more cups (11%). H₀: The observed frequencies follow the claimed distribution. Hₐ: The observed frequencies do not follow the claimed distribution.
Step 2: Calculate the expected frequencies for each category using the total sample size (1600) and the claimed percentages. For example, for 0 cups, the expected frequency is calculated as 1600 × 0.36 = 576. Repeat this for all categories: 1 cup, 2 cups, 3 cups, and 4 or more cups.
Step 3: Compute the chi-square test statistic using the formula: χ² = Σ((Oᵢ - Eᵢ)² / Eᵢ), where Oᵢ is the observed frequency and Eᵢ is the expected frequency for each category. Perform this calculation for each category and sum the results.
Step 4: Determine the critical value for the chi-square test at α = 0.05 with degrees of freedom (df). The degrees of freedom are calculated as df = (number of categories - 1). In this case, df = 5 - 1 = 4. Use a chi-square distribution table to find the critical value for df = 4 and α = 0.05.
Step 5: Compare the calculated chi-square test statistic to the critical value. If the test statistic exceeds the critical value, reject the null hypothesis (H₀). Otherwise, fail to reject H₀. Interpret the decision in the context of the original claim: If H₀ is rejected, the observed frequencies do not match the claimed distribution; if H₀ is not rejected, the observed frequencies are consistent with the claimed distribution.
 Verified video answer for a similar problem:
This video solution was recommended by our tutors as helpful for the problem above
Video duration:
5mPlay a video:
Key Concepts
Here are the essential concepts you must grasp in order to answer the question correctly.
Chi-Square Goodness-of-Fit Test
The Chi-Square Goodness-of-Fit Test is a statistical method used to determine if a sample distribution matches an expected distribution. It compares the observed frequencies of outcomes in categorical data to the frequencies expected under a specific hypothesis. This test helps assess whether the differences between observed and expected values are due to chance or indicate a significant deviation.
Recommended video:
Guided course

Goodness of Fit Test
Null and Alternative Hypotheses (H₀ and Hₐ)
In hypothesis testing, the null hypothesis (H₀) represents a statement of no effect or no difference, while the alternative hypothesis (Hₐ) suggests that there is an effect or a difference. For the Chi-Square Goodness-of-Fit Test, H₀ typically states that the observed distribution of data matches the expected distribution, while Hₐ posits that there is a significant difference between the two.
Recommended video:
Guided course

Step 1: Write Hypotheses
Critical Value and Rejection Region
The critical value in hypothesis testing is a threshold that determines the boundary for rejecting the null hypothesis. It is derived from the significance level (α), which indicates the probability of making a Type I error. The rejection region is the range of values for the test statistic that leads to the rejection of H₀; if the calculated test statistic falls within this region, the null hypothesis is rejected in favor of the alternative hypothesis.
Recommended video:

Critical Values: t-Distribution

 1:17m
1:17mWatch next
Master Goodness of Fit Test with a bite sized video explanation from Patrick
Start learningRelated Videos
Related Practice
Multiple Choice
40
views
2
rank
