A gym owner wants to know if the gym has similar numbers of members across different age groups. The table shows the distribution of ages for members from a random survey. Does this data set fit the criteria for a G.O.F. test?
Table of contents
- 1. Intro to Stats and Collecting Data1h 14m
- 2. Describing Data with Tables and Graphs1h 55m
- 3. Describing Data Numerically2h 5m
- 4. Probability2h 16m
- 5. Binomial Distribution & Discrete Random Variables3h 6m
- 6. Normal Distribution and Continuous Random Variables2h 11m
- 7. Sampling Distributions & Confidence Intervals: Mean3h 23m
- Sampling Distribution of the Sample Mean and Central Limit Theorem19m
- Distribution of Sample Mean - Excel23m
- Introduction to Confidence Intervals15m
- Confidence Intervals for Population Mean1h 18m
- Determining the Minimum Sample Size Required12m
- Finding Probabilities and T Critical Values - Excel28m
- Confidence Intervals for Population Means - Excel25m
- 8. Sampling Distributions & Confidence Intervals: Proportion2h 10m
- 9. Hypothesis Testing for One Sample5h 8m
- Steps in Hypothesis Testing1h 6m
- Performing Hypothesis Tests: Means1h 4m
- Hypothesis Testing: Means - Excel42m
- Performing Hypothesis Tests: Proportions37m
- Hypothesis Testing: Proportions - Excel27m
- Performing Hypothesis Tests: Variance12m
- Critical Values and Rejection Regions28m
- Link Between Confidence Intervals and Hypothesis Testing12m
- Type I & Type II Errors16m
- 10. Hypothesis Testing for Two Samples5h 37m
- Two Proportions1h 13m
- Two Proportions Hypothesis Test - Excel28m
- Two Means - Unknown, Unequal Variance1h 3m
- Two Means - Unknown Variances Hypothesis Test - Excel12m
- Two Means - Unknown, Equal Variance15m
- Two Means - Unknown, Equal Variances Hypothesis Test - Excel9m
- Two Means - Known Variance12m
- Two Means - Sigma Known Hypothesis Test - Excel21m
- Two Means - Matched Pairs (Dependent Samples)42m
- Matched Pairs Hypothesis Test - Excel12m
- Two Variances and F Distribution29m
- Two Variances - Graphing Calculator16m
- 11. Correlation1h 24m
- 12. Regression3h 33m
- Linear Regression & Least Squares Method26m
- Residuals12m
- Coefficient of Determination12m
- Regression Line Equation and Coefficient of Determination - Excel8m
- Finding Residuals and Creating Residual Plots - Excel11m
- Inferences for Slope31m
- Enabling Data Analysis Toolpak1m
- Regression Readout of the Data Analysis Toolpak - Excel21m
- Prediction Intervals13m
- Prediction Intervals - Excel19m
- Multiple Regression - Excel29m
- Quadratic Regression15m
- Quadratic Regression - Excel10m
- 13. Chi-Square Tests & Goodness of Fit2h 21m
- 14. ANOVA2h 28m
13. Chi-Square Tests & Goodness of Fit
Goodness of Fit Test
Problem 10.1.6
Textbook Question
Finding Expected Frequencies
In Exercises 3–6, find the expected frequency for the values of n and pᵢ.
n=415, pᵢ=0.08
 Verified step by step guidance
1
Identify the formula for calculating the expected frequency: Expected Frequency (E) = n × pᵢ, where n is the total number of observations and pᵢ is the probability of the specific category.
Substitute the given values into the formula. Here, n = 415 and pᵢ = 0.08.
Perform the multiplication: Multiply 415 by 0.08 to calculate the expected frequency.
Interpret the result: The expected frequency represents the number of occurrences you would expect in the specific category based on the given probability and total observations.
Ensure the result is reasonable: Verify that the expected frequency is a positive value and makes sense in the context of the problem.
 Verified video answer for a similar problem:
This video solution was recommended by our tutors as helpful for the problem above
Video duration:
1mPlay a video:
Key Concepts
Here are the essential concepts you must grasp in order to answer the question correctly.
Expected Frequency
Expected frequency is a statistical term that refers to the anticipated number of occurrences of an event in a given sample size, based on a specific probability. It is calculated by multiplying the total number of observations (n) by the probability of the event (pᵢ). In this case, with n=415 and pᵢ=0.08, the expected frequency can be found by calculating 415 * 0.08.
Recommended video:
Guided course

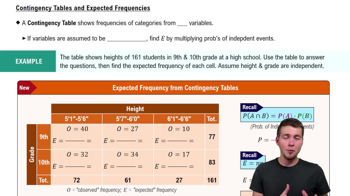
Contingency Tables & Expected Frequencies
Probability
Probability is a measure of the likelihood that a particular event will occur, expressed as a number between 0 and 1. A probability of 0 indicates that the event will not occur, while a probability of 1 indicates certainty. In the context of this question, pᵢ=0.08 signifies that there is an 8% chance of the event happening in any given trial.
Recommended video:

Introduction to Probability
Sample Size
Sample size refers to the number of observations or data points collected in a study or experiment. It is crucial for determining the reliability and validity of statistical results. In this question, n=415 indicates that the analysis is based on 415 observations, which influences the calculation of expected frequencies and the overall statistical inference.
Recommended video:

Sampling Distribution of Sample Proportion

 1:17m
1:17mWatch next
Master Goodness of Fit Test with a bite sized video explanation from Patrick
Start learningRelated Videos
Related Practice
Multiple Choice
104
views
