
Textbook Question
In Exercises 7–10, (d) explain how you should interpret a decision that rejects the null hypothesis.
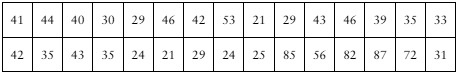
An energy bar maker claims that the mean number of grams of carbohydrates in one bar is less than 25.
64
views
 Verified step by step guidanceVerified video answer for a similar problem:
 06:21
06:21 03:33
03:33 08:24
08:24