

 06:34
06:34


Textbook Question
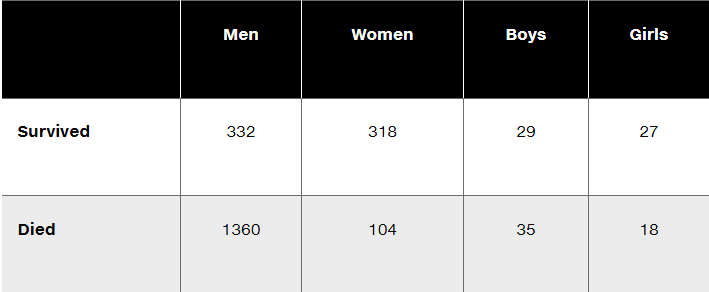
[NOW WORK] Job Satisfaction Is there an association between one’s level of education and satisfaction with work? A random sample of 5244 employed individuals were asked to disclose their highest level of education and satisfaction with their work/job. The results are shown in the table below. The data are from the General Social Survey.
b. Verify that the requirements for performing a chi-square test of independence are satisfied.
48
views