Here are the essential concepts you must grasp in order to answer the question correctly.
Sampling Distribution of the Mean
The sampling distribution of the mean describes the distribution of sample means obtained from a population. When samples of a fixed size are taken, the means of these samples will form their own distribution, which is typically normal if the sample size is sufficiently large, according to the Central Limit Theorem. In this case, the mean of the sampling distribution is equal to the population mean, and its standard deviation is the population standard deviation divided by the square root of the sample size.
Recommended video:
Sampling Distribution of Sample Proportion
Standard Error
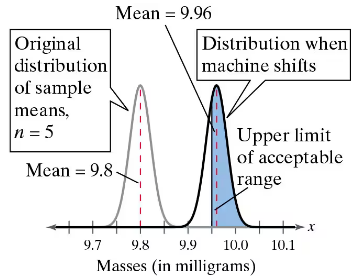
Standard error is a measure of the variability of sample means around the population mean. It is calculated as the population standard deviation divided by the square root of the sample size (n). In this scenario, with a standard deviation of 0.05 milligrams and a sample size of 5, the standard error helps determine how much the sample mean is expected to fluctuate, which is crucial for calculating probabilities related to the sample mean.
Recommended video:
Calculating Standard Deviation
Probability and Normal Distribution
Probability in statistics often involves determining the likelihood of a certain outcome occurring within a defined range. When dealing with normally distributed data, probabilities can be calculated using z-scores, which standardize the values based on the mean and standard deviation. In this question, the probability of selecting a sample mean within an acceptable range can be found by calculating the area under the normal curve between the specified limits, which is represented in the provided figure.
Recommended video:
Using the Normal Distribution to Approximate Binomial Probabilities