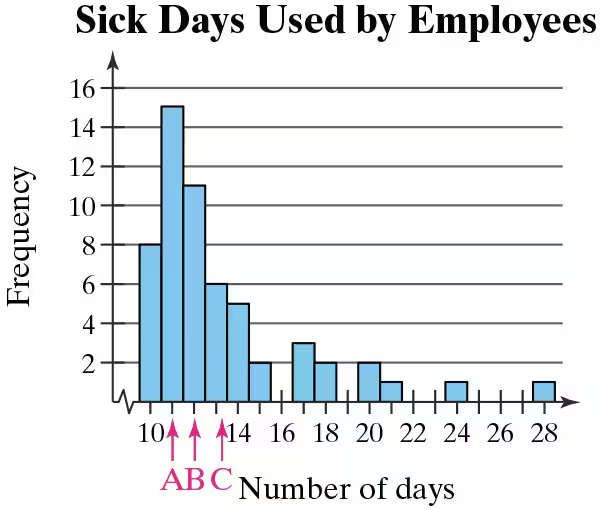
Graphical Analysis In Exercises 3–5, the histogram represents a binomial distribution with five trials. Match the histogram with the appropriate probability of success p. Explain your reasoning.
a. p = 0.25
b. p = 0.50
c. p = 0.75

 Verified step by step guidance
 Verified video answer for a similar problem:

