True or False: The shape of the distribution shown is best classified as uniform.
Table of contents
- 1. Intro to Stats and Collecting Data1h 14m
- 2. Describing Data with Tables and Graphs1h 56m
- 3. Describing Data Numerically2h 5m
- 4. Probability2h 17m
- 5. Binomial Distribution & Discrete Random Variables3h 6m
- 6. Normal Distribution and Continuous Random Variables2h 11m
- 7. Sampling Distributions & Confidence Intervals: Mean3h 23m
- Sampling Distribution of the Sample Mean and Central Limit Theorem19m
- Distribution of Sample Mean - ExcelBonus23m
- Introduction to Confidence Intervals15m
- Confidence Intervals for Population Mean1h 18m
- Determining the Minimum Sample Size Required12m
- Finding Probabilities and T Critical Values - ExcelBonus28m
- Confidence Intervals for Population Means - ExcelBonus25m
- 8. Sampling Distributions & Confidence Intervals: Proportion2h 10m
- 9. Hypothesis Testing for One Sample5h 8m
- Steps in Hypothesis Testing1h 6m
- Performing Hypothesis Tests: Means1h 4m
- Hypothesis Testing: Means - ExcelBonus42m
- Performing Hypothesis Tests: Proportions37m
- Hypothesis Testing: Proportions - ExcelBonus27m
- Performing Hypothesis Tests: Variance12m
- Critical Values and Rejection Regions28m
- Link Between Confidence Intervals and Hypothesis Testing12m
- Type I & Type II Errors16m
- 10. Hypothesis Testing for Two Samples5h 37m
- Two Proportions1h 13m
- Two Proportions Hypothesis Test - ExcelBonus28m
- Two Means - Unknown, Unequal Variance1h 3m
- Two Means - Unknown Variances Hypothesis Test - ExcelBonus12m
- Two Means - Unknown, Equal Variance15m
- Two Means - Unknown, Equal Variances Hypothesis Test - ExcelBonus9m
- Two Means - Known Variance12m
- Two Means - Sigma Known Hypothesis Test - ExcelBonus21m
- Two Means - Matched Pairs (Dependent Samples)42m
- Matched Pairs Hypothesis Test - ExcelBonus12m
- Two Variances and F Distribution29m
- Two Variances - Graphing CalculatorBonus16m
- 11. Correlation1h 24m
- 12. Regression3h 33m
- Linear Regression & Least Squares Method26m
- Residuals12m
- Coefficient of Determination12m
- Regression Line Equation and Coefficient of Determination - ExcelBonus8m
- Finding Residuals and Creating Residual Plots - ExcelBonus11m
- Inferences for Slope31m
- Enabling Data Analysis ToolpakBonus1m
- Regression Readout of the Data Analysis Toolpak - ExcelBonus21m
- Prediction Intervals13m
- Prediction Intervals - ExcelBonus19m
- Multiple Regression - ExcelBonus29m
- Quadratic Regression15m
- Quadratic Regression - ExcelBonus10m
- 13. Chi-Square Tests & Goodness of Fit2h 21m
- 14. ANOVA2h 29m
2. Describing Data with Tables and Graphs
Histograms
Problem 2.2.7
Textbook Question
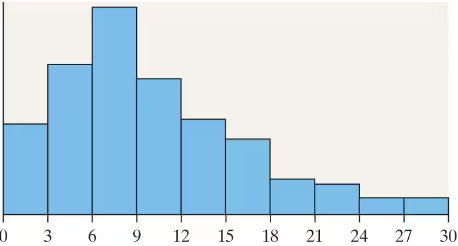
True or False: The shape of the distribution shown is best classified as skewed left.

Verified step by step guidance1
Step 1: Understand the concept of skewness. A distribution is skewed left (negatively skewed) if the tail on the left side (lower values) is longer or fatter than the right side. Conversely, it is skewed right (positively skewed) if the tail on the right side (higher values) is longer or fatter.
Step 2: Observe the histogram bars. Notice that the tallest bars are on the left side of the graph, and the heights of the bars gradually decrease as you move to the right.
Step 3: Identify the tail of the distribution. Since the bars decrease gradually toward the right, the tail extends to the right side, not the left.
Step 4: Based on the tail direction, conclude the skewness. Because the tail is on the right side, the distribution is skewed right, not skewed left.
Step 5: Therefore, the statement 'The shape of the distribution shown is best classified as skewed left' is false.
Verified video answer for a similar problem:This video solution was recommended by our tutors as helpful for the problem above
Video duration:
1mPlay a video:
0 Comments
Key Concepts
Here are the essential concepts you must grasp in order to answer the question correctly.
Skewness of a Distribution
Skewness describes the asymmetry of a distribution's shape. A distribution is skewed left (negatively skewed) if the tail on the left side is longer or fatter, with most data concentrated on the right. Conversely, skewed right means the tail is longer on the right side.
Recommended video:
Sampling Distribution of Sample Mean
Interpreting Histograms
Histograms display data frequency across intervals using bars. Taller bars indicate higher frequencies. By examining the shape and tail lengths of the bars, one can determine the distribution's skewness and overall pattern.
Recommended video:
Guided course
Intro to Histograms
True or False Questions in Statistics
True or False questions require understanding key definitions and applying them to given data. Correctly classifying distribution shape depends on accurately interpreting the histogram and knowing the criteria for skewness.
Recommended video:
Guided course
Parameters vs. Statistics
Related Videos
Related Practice
Textbook Question
47
views
