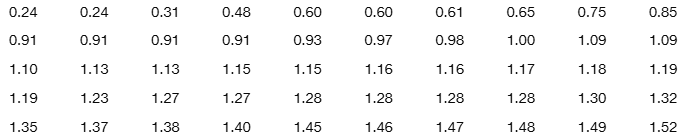
Here are the essential concepts you must grasp in order to answer the question correctly.
Percentiles
A percentile is a measure used in statistics to indicate the value below which a given percentage of observations fall. For example, the 50th percentile (P50) is the median, meaning that 50% of the data points are below this value. Understanding percentiles helps in interpreting the distribution of data and comparing individual scores to a larger dataset.
Quartiles
Quartiles are specific percentiles that divide a dataset into four equal parts. The first quartile (Q1) represents the 25th percentile, the second quartile (Q2) is the median or 50th percentile, and the third quartile (Q3) is the 75th percentile. Quartiles are useful for understanding the spread and center of a dataset, as they provide insights into the distribution of values.
Recommended video:
Find 5-Number Summary - TI-84 Calculator
Data Distribution
Data distribution refers to the way in which data points are spread or arranged across different values. It can be visualized using graphs like histograms or box plots, which help identify patterns such as skewness, central tendency, and variability. Understanding the distribution of data is crucial for accurately calculating percentiles and quartiles, as these measures depend on the arrangement of the data.
Recommended video:
Visualizing Qualitative vs. Quantitative Data