Here are the essential concepts you must grasp in order to answer the question correctly.
Correlation
Correlation measures the strength and direction of a linear relationship between two variables. It is quantified using the correlation coefficient, which ranges from -1 to 1. A value of 1 indicates a perfect positive correlation, -1 indicates a perfect negative correlation, and 0 indicates no correlation. Understanding correlation is essential for interpreting scatterplots and determining how closely related two variables are.
Recommended video:
Scatterplot
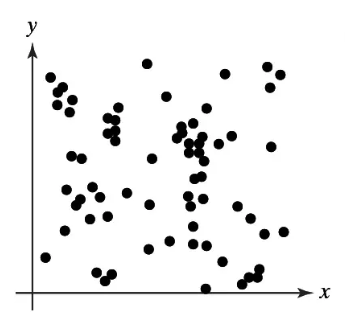
A scatterplot is a graphical representation of two quantitative variables, where each point represents an observation. The position of each point indicates the values of the two variables, allowing for visual assessment of relationships. In the context of correlation, scatterplots help identify patterns, such as linear relationships, clusters, or randomness, which are crucial for determining the type of correlation present.
Recommended video:
Scatterplots & Intro to Correlation
Linear Correlation Types
Linear correlation can be classified into several types: perfect positive, strong positive, perfect negative, strong negative, and no correlation. Perfect positive correlation means that as one variable increases, the other does so in a perfectly linear manner. Strong correlations indicate a close relationship but with some variability. No correlation suggests that changes in one variable do not predict changes in the other, as seen in the provided scatterplot.
Recommended video: