Here are the essential concepts you must grasp in order to answer the question correctly.
Correlation
Correlation measures the strength and direction of a linear relationship between two variables. It is quantified using the correlation coefficient, which ranges from -1 to 1. A value of 1 indicates a perfect positive correlation, -1 indicates a perfect negative correlation, and 0 indicates no linear correlation.
Recommended video:
Scatterplot
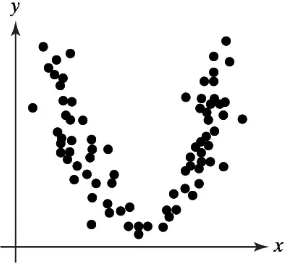
A scatterplot is a graphical representation of two variables, where each point represents an observation. It helps visualize the relationship between the variables, allowing for the identification of patterns, trends, or correlations. In this case, the scatterplot shows a curved pattern, indicating a non-linear relationship.
Recommended video:
Scatterplots & Intro to Correlation
Linear vs. Non-linear Relationships
Linear relationships imply that changes in one variable result in proportional changes in another, represented by a straight line. Non-linear relationships, however, do not follow this pattern, as seen in the provided scatterplot, which suggests a quadratic relationship rather than a linear one, indicating no linear correlation.
Recommended video:
Intro to Least Squares Regression