Table of contents
- 1. Intro to Stats and Collecting Data(0)
- 2. Describing Data with Tables and Graphs(0)
- 3. Describing Data Numerically(0)
- 4. Probability(0)
- 5. Binomial Distribution & Discrete Random Variables(0)
- 6. Normal Distribution and Continuous Random Variables(0)
- 7. Sampling Distributions & Confidence Intervals: Mean(0)
- 8. Sampling Distributions & Confidence Intervals: Proportion(0)
- 9. Hypothesis Testing for One Sample(0)
- 10. Hypothesis Testing for Two Samples(0)
- 11. Correlation(0)
- 12. Regression(0)
- 13. Chi-Square Tests & Goodness of Fit(0)
- 14. ANOVA(0)
1. Intro to Stats and Collecting Data
Intro to Stats
1. Intro to Stats and Collecting Data
Intro to Stats: Videos & Practice Problems
127 of 0
Problem 127Multiple Choice
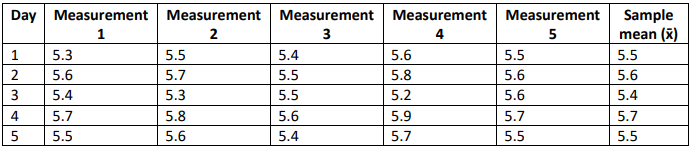
A manufacturing company produces rechargeable batteries, and their lifespan is tested over multiple production days. The company collects five lifespan measurements (in hours) each day for quality control purposes. The following table presents the collected data:

Treat the measurements from each day as a sample and construct an x̄ chart. What does the result suggest? Use the provided control limits:
hours
Lower Control Limit (LCL) hours
Upper Control Limit (UCL) hours
0 Comments