Table of contents
- 1. Intro to Stats and Collecting Data(0)
- 2. Describing Data with Tables and Graphs(0)
- 3. Describing Data Numerically(0)
- 4. Probability(0)
- 5. Binomial Distribution & Discrete Random Variables(0)
- 6. Normal Distribution and Continuous Random Variables(0)
- 7. Sampling Distributions & Confidence Intervals: Mean(0)
- 8. Sampling Distributions & Confidence Intervals: Proportion(0)
- 9. Hypothesis Testing for One Sample(0)
- 10. Hypothesis Testing for Two Samples(0)
- 11. Correlation(0)
- 12. Regression(0)
- 13. Chi-Square Tests & Goodness of Fit(0)
- 14. ANOVA(0)
1. Intro to Stats and Collecting Data
Intro to Stats
1. Intro to Stats and Collecting Data
Intro to Stats: Videos & Practice Problems
126 of 0
Problem 126Multiple Choice
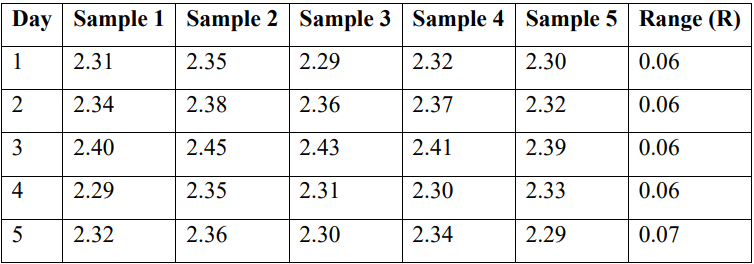
A manufacturing company produces metal washers and measures their thickness to ensure consistency. The thickness measurements (in mm) are taken from 5 washers per day for 5 consecutive days. The data is presented below:

The average range (R̅) for these samples is 0.062.
LCL for the R-chart = 0
UCL for the R-chart = 0.131
Treat the five measurements from each day as a sample and construct an R chart. What does the chart suggest about the stability of the process?
0 Comments