Skip to main content
Statistics
My Course
Learn
Exam Prep
AI Tutor
Study Guides
Textbook Solutions
Flashcards
Explore
Try the app
My Course
Learn
Exam Prep
AI Tutor
Study Guides
Textbook Solutions
Flashcards
Explore
Try the app
Back
Distribution of Sample Mean - Excel definitions
You can tap to flip the card.
Sampling Distribution
You can tap to flip the card.
👆
Sampling Distribution
A collection of sample means from repeated samples, used to analyze variability and probability in statistical inference.
Track progress
Control buttons has been changed to "navigation" mode.
1/15
Related flashcards
Related practice
Recommended videos
Distribution of Sample Mean - Excel quiz
Distribution of Sample Mean - Excel
15 Terms
Introduction to Confidence Intervals
7. Sampling Distributions & Confidence Intervals: Mean
6 problems
Topic
Ernest
7. Sampling Distributions & Confidence Intervals: Mean
2 topics
6 problems
Chapter
Ally
08:08
Finding Probabilities for Sample Means - Excel Example 1
214
views
3
rank
09:51
Finding Probabilities for Sample Means - Excel
459
views
4
rank
05:15
Finding Probabilities for Sample Means - Excel Example 2
178
views
6
rank
Terms in this set (15)
Hide definitions
Sampling Distribution
A collection of sample means from repeated samples, used to analyze variability and probability in statistical inference.
Sample Mean
An average calculated from a sample, serving as a point estimate for the population mean in probability calculations.
Population Mean
A central value representing the average of all items in a population, used as a reference in sampling distributions.
Standard Deviation
A measure of spread indicating how much values in a dataset differ from the mean, crucial for probability calculations.
Central Limit Theorem
A principle stating that the distribution of sample means approaches normality as sample size increases, enabling inference.
Normal Distribution
A symmetric, bell-shaped curve describing data spread, foundational for calculating probabilities in sampling.
Left Tail Probability
A likelihood that a sample mean falls below a specified value, often calculated using cumulative functions.
Right Tail Probability
A likelihood that a sample mean exceeds a specified value, found by subtracting left tail probability from one.
Cumulative Probability
A total likelihood up to a certain value, used to determine the chance of observing values below a threshold.
Sample Size
A count of observations in a sample, affecting the precision and variability of the sampling distribution.
Population Standard Deviation
A measure of variability for an entire population, used to compute the standard deviation of the sampling distribution.
Standard Deviation of Sampling Distribution
A value calculated by dividing population standard deviation by the square root of sample size, indicating spread of sample means.
Quality Control
A process in manufacturing or service industries where sample means are used to monitor and maintain product standards.
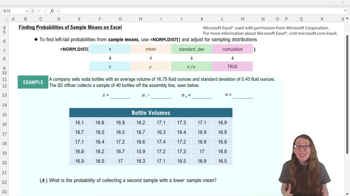
NORM.DIST Function
An Excel tool for finding probabilities in normal distributions, adapted for sampling distributions by adjusting inputs.
Equals Average Function
An Excel command used to compute the mean of a dataset, essential for determining sample mean in probability calculations.
 BackBack

 08:08
08:08