Skip to main content
Statistics
My Course
Learn
Exam Prep
AI Tutor
Study Guides
Textbook Solutions
Flashcards
Explore
Try the app
My Course
Learn
Exam Prep
AI Tutor
Study Guides
Textbook Solutions
Flashcards
Explore
Try the app
Back
Two Proportions Hypothesis Test - Excel quiz
You can tap to flip the card.
What is the null hypothesis in a two population proportions hypothesis test?
You can tap to flip the card.
👆
What is the null hypothesis in a two population proportions hypothesis test?
The null hypothesis states that the two proportions are equal.
Track progress
Control buttons has been changed to "navigation" mode.
1/15
Related flashcards
Related practice
Recommended videos
Two Proportions Hypothesis Test - Excel definitions
Two Proportions Hypothesis Test - Excel
15 Terms
Two Means - Unknown, Unequal Variance
10. Hypothesis Testing for Two Samples
3 problems
Topic
Justin
10. Hypothesis Testing for Two Samples
3 topics
6 problems
Chapter
Brendan
09:31
Two Proportions Hypothesis Test - Excel
197
views
1
rank
08:25
Two Proportions Hypothesis Test - Excel Example 1
144
views
2
rank
10:28
Two Proportions Hypothesis Test - Excel Example 2
96
views
1
rank
Terms in this set (15)
Hide definitions
What is the null hypothesis in a two population proportions hypothesis test?
The null hypothesis states that the two proportions are equal.
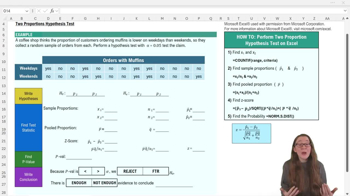
How do you define the alternative hypothesis for comparing weekday and weekend muffin orders?
The alternative hypothesis is that the proportion of muffin orders is lower on weekdays than weekends (p1 < p2).
Which Excel function is used to count the number of orders with muffins in a sample?
The COUNTIF function is used to count the number of orders with muffins.
How do you calculate the sample proportion in Excel?
Divide the count of orders with muffins (x) by the sample size (n) to get the sample proportion.
What is the formula for the pooled proportion (p bar) in a two proportions test?
Add the counts of successes from both samples and divide by the total sample size from both groups.
How do you calculate q bar in Excel for the z-score formula?
q bar is calculated as 1 minus p bar.
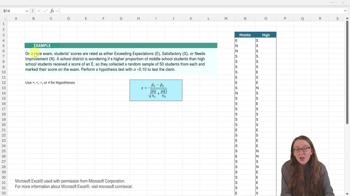
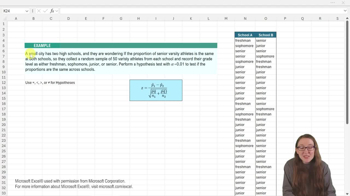
What is the numerator in the z-score formula for two proportions?
The numerator is the difference between the two sample proportions, p1 hat minus p2 hat.
How do you calculate the denominator of the z-score formula in Excel?
The denominator is the square root of (p bar × q bar / n1) plus (p bar × q bar / n2).
Which Excel function is used to calculate the left tail probability (p-value) from a z-score?
The NORM.S.DIST function is used to calculate the cumulative left tail probability.
What does it mean if the p-value is greater than the significance level alpha?
If the p-value is greater than alpha, you fail to reject the null hypothesis.
What conclusion can you draw if you fail to reject the null hypothesis in this test?
There is not enough evidence to conclude that the proportion of muffin orders is less on weekdays than weekends.
What is the significance level (alpha) commonly used in hypothesis testing?
A common significance level is 0.05.
Why is it helpful to break down the z-score formula into smaller parts in Excel?
Breaking down the formula reduces errors and makes calculations easier to manage.
How do you find the sample sizes n1 and n2 in Excel for this test?
Count the number of data points in each sample group; in the example, both n1 and n2 are 13.
What is the final step in a two proportions hypothesis test in Excel?
Compare the p-value to alpha and state whether to reject or fail to reject the null hypothesis.
 BackBack
 09:31
09:31