 Back
Back5.2 Binomial Probability Distributions: Concepts, Calculations, and Applications
Study Guide - Smart Notes
 Tailored notes based on your materials, expanded with key definitions, examples, and context.
Binomial Probability Distributions
Introduction to Binomial Probability Distributions
The binomial probability distribution is a fundamental concept in statistics, describing the probability of obtaining a fixed number of successes in a specified number of independent trials, where each trial has only two possible outcomes. This section covers the definition, requirements, notation, calculation methods, and interpretation of binomial probability distributions.
Requirements for a Binomial Probability Distribution
Fixed Number of Trials (n): The experiment consists of a set number of repeated trials.
Independence: The outcome of any individual trial does not affect the outcomes of the other trials.
Two Categories: Each trial results in one of two outcomes, commonly labeled as "success" (S) and "failure" (F).
Constant Probability: The probability of success (p) remains the same for each trial.
Examples:
Testing a drug: Each patient either responds (success) or does not (failure).
Sales attempts: Each customer either makes a purchase (success) or not (failure).
Taste tests: Each participant prefers one of two options.
Notation for Binomial Probability Distributions
n: Number of trials
x: Number of successes in n trials (x = 0, 1, ..., n)
p: Probability of success in a single trial
q: Probability of failure in one of the n trials (q = 1 − p)
P(x): Probability of exactly x successes in n trials
Important Note: The term "success" is arbitrary and does not imply a positive outcome. It simply refers to the outcome of interest. Always ensure that x and p refer to the same definition of success.
Calculating Binomial Probabilities
Methods for Finding Binomial Probabilities
1. Binomial Probability Formula: The primary method for calculating binomial probabilities.
2. Software: Tools such as Excel or statistical software can compute probabilities efficiently, especially for large n.
3. Probability Tables: (Not required for this course) Precomputed tables for common values of n and p.
Binomial Probability Formula
The probability of obtaining exactly x successes in n independent trials is given by:
where denotes the factorial of n.
Example: Probability of Cashless Adults
Suppose the probability that a randomly selected adult is cashless is 0.05. What is the probability that exactly 2 out of 10 randomly selected adults are cashless?
n = 10 (number of trials)
x = 2 (number of successes)
p = 0.05 (probability of success)
q = 0.95 (probability of failure)
Applying the formula:
Using Excel to Calculate Binomial Probabilities
Excel provides built-in functions to compute binomial probabilities efficiently. The BINOM.DIST function can be used for this purpose.
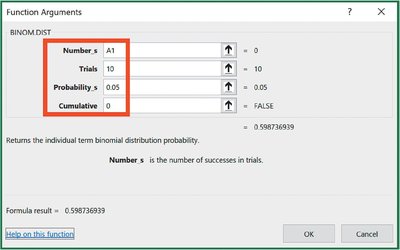

Example: To find the probability of exactly 2 successes in 10 trials with p = 0.05, use the formula:
=BINOM.DIST(2, 10, 0.05, 0)
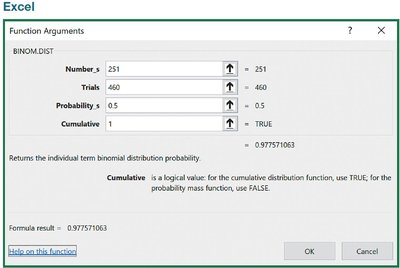
Application: Overtime Rule in Football
Suppose in 460 NFL overtime games, the team winning the coin toss won 252 times. Is this result significantly high, or could it be due to chance?
n = 460
p = 0.5 (assuming equal chance)
q = 0.5
We want P(x ≥ 252)
Using Excel, the probability of 251 or fewer wins is 0.978. Therefore, the probability of 252 or more wins is 1 - 0.978 = 0.022, which is less than 0.05, indicating that 252 wins is significantly high and unlikely due to chance alone.
Mean, Variance, and Standard Deviation of Binomial Distributions
Formulas
Mean (μ):
Variance (σ²):
Standard Deviation (σ):
Example: Interpreting Significance with Parameters
For n = 460, p = 0.5, q = 0.5:
Mean:
Standard deviation:
Using the Range Rule of Thumb:
Significantly low values:
Significantly high values:
Values between 208.6 and 251.4 are not considered significant.
Since 252 is greater than 251.4, it is significantly high.
Determining Significantly High or Low Results
Significantly high: x is significantly high if
Significantly low: x is significantly low if
Summary Table: Binomial Probability Distribution Properties
Parameter | Symbol | Formula |
|---|---|---|
Mean | μ | |
Variance | σ² | |
Standard Deviation | σ |
Additional info: The binomial distribution is widely used in quality control, clinical trials, and survey sampling, where the outcome of interest is binary (e.g., defective/non-defective, success/failure, yes/no).
