 Back
BackChapter 15: Testing Hypotheses – Study Notes
Study Guide - Smart Notes
 Tailored notes based on your materials, expanded with key definitions, examples, and context.
Chapter 15: Testing Hypotheses
Introduction to Hypothesis Testing
Hypothesis testing is a fundamental statistical method used to make inferences about population parameters based on sample data. It allows us to assess whether observed data provide sufficient evidence to support a specific claim or if the results could be due to random chance.
Hypothesis: A proposed explanation or claim about a population parameter (e.g., mean, proportion).
Hypothesis Test: The process of using sample data to evaluate the validity of a hypothesis about a population parameter.
Example: Claiming that students who eat before school perform better than those who do not.
Null and Alternative Hypotheses
Every hypothesis test involves two competing statements:
Null Hypothesis (H0): Represents the status quo or no effect. It is the hypothesis that there is no difference or change. For example, in coin flipping, H0: p = 0.5 (just guessing).
Alternative Hypothesis (Ha): Represents the claim being tested, such as an effect, difference, or change. For coin flipping, Ha: p > 0.5 (better than guessing).
Types of Hypothesis Tests
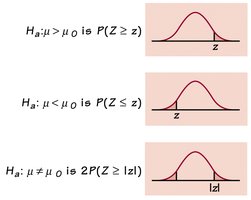
Right-tailed test: Tests if the parameter is greater than a specified value (Ha: μ > μ0).
Left-tailed test: Tests if the parameter is less than a specified value (Ha: μ < μ0).
Two-tailed test: Tests if the parameter is different from a specified value (Ha: μ ≠ μ0).
Test Statistics and P-values
The test statistic measures how far the sample statistic is from the null hypothesis value, in standard error units. The P-value quantifies the probability of observing a test statistic as extreme as, or more extreme than, the one observed, assuming the null hypothesis is true.
One-Proportion z-Test: Used to test hypotheses about a population proportion.
One-Sample t-Test: Used to test hypotheses about a population mean when the population standard deviation is unknown.
Test Statistic Formulas:
For proportions (z-test):
For means (t-test):
P-value Interpretation: The P-value is the probability of obtaining a result as extreme as the observed one, assuming the null hypothesis is true. The smaller the P-value, the stronger the evidence against H0.
Significance Level (α)
The significance level (α) is the threshold for deciding whether the P-value is small enough to reject the null hypothesis. Common choices are 0.05, 0.01, or 0.10.
If P-value < α: Reject H0 (statistically significant result).
If P-value > α: Fail to Reject H0 (not statistically significant).
Interpreting Hypothesis Test Results
Reject H0: There is strong evidence in favor of the alternative hypothesis.
Fail to Reject H0: There is not enough evidence to support the alternative hypothesis. This does not mean H0 is true.
Conditions and Assumptions for Hypothesis Tests
Before conducting a hypothesis test, certain conditions must be met to ensure the validity of the results:
Independence: Observations must be independent. This is often ensured by random sampling or random assignment.
Sample Size: For means, the sample size should be large enough. For small samples, the population should be nearly normal.
Normality: For t-tests, the population should be normal or the sample size should be large (Central Limit Theorem).
10% Condition: The sample should be no more than 10% of the population if sampling without replacement.
Quiz Example: Conditions for Estimating the Mean
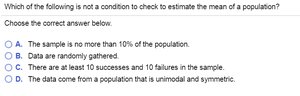
Which is not a condition to check for estimating the mean of a population?
Answer: "There are at least 10 successes and 10 failures in the sample" (this is for proportions, not means).
One-Proportion z-Test
The one-proportion z-test is used to test hypotheses about a population proportion. For example, testing if the proportion of correct coin flip predictions is greater than 0.5.
Null Hypothesis: p = p0
Alternative Hypothesis: p > p0, p < p0, or p ≠ p0
Test Statistic:
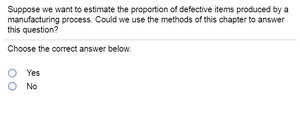
Quiz Example: Proportion Estimation
Can the methods of this chapter be used to estimate the proportion of defective items in a manufacturing process? Yes, if the conditions for the z-test are met.
One-Sample t-Test for Means
The one-sample t-test is used to test hypotheses about a population mean when the population standard deviation is unknown.
Null Hypothesis: μ = μ0
Alternative Hypothesis: μ > μ0, μ < μ0, or μ ≠ μ0
Test Statistic:
Degrees of Freedom: df = n - 1
P-value Calculation: The P-value is the probability of observing a t-statistic as extreme as the one calculated, under the null hypothesis.
Summary Table: Types of Tests and When to Use
Test | Parameter | Conditions | Test Statistic |
|---|---|---|---|
One-Proportion z-Test | p | Random sample, at least 10 successes and 10 failures | |
One-Sample t-Test | μ | Random sample, normal population or large n |
Key Takeaways
Hypothesis testing is a structured process for evaluating claims about population parameters.
The P-value measures the strength of evidence against the null hypothesis.
Always check the necessary conditions before conducting a hypothesis test.
Interpret results in the context of the significance level and the research question.
Additional info: The analogy of hypothesis testing to a courtroom trial helps clarify the logic: the null hypothesis is presumed true (innocent) until evidence (data) is strong enough to reject it (beyond a reasonable doubt).
