 Back
BackChapter 3: Describing, Exploring, and Comparing Data – Biostatistics Study Notes
Study Guide - Smart Notes
 Tailored notes based on your materials, expanded with key definitions, examples, and context.
Describing, Exploring, and Comparing Data
Measures of Center
Measures of center are statistical values that describe the central point of a data set. The most common measures include the mean, median, mode, and midrange. Understanding these helps summarize and interpret data effectively.
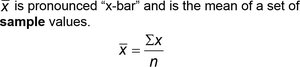
Mean (Arithmetic Mean): The mean is calculated by adding all data values and dividing by the number of values. It uses every data value and is sensitive to outliers, making it non-resistant.
Median: The median is the middle value when data is sorted. It is resistant to outliers and does not directly use every data value.
Mode: The mode is the value(s) that occur most frequently. It can be used with qualitative data and a data set may have no mode, one mode, or multiple modes.
Midrange: The midrange is the value midway between the maximum and minimum values. It is easy to compute but highly sensitive to extremes.
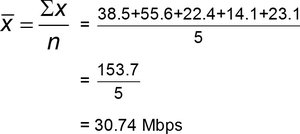
Example: Calculating the mean for Verizon data speeds: 38.5, 55.6, 22.4, 14.1, 23.1 Mbps.
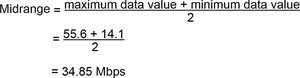
Example: Calculating the midrange for the same data set.
Additional info: The mean is not resistant to outliers, while the median is. The mode is useful for categorical data, and the midrange is rarely used in practice.
Measures of Variation
Measures of variation describe how spread out the data values are. The most important measures are range, standard deviation, and variance. These statistics help quantify the variability within a data set.
Range: The difference between the maximum and minimum values. It is sensitive to outliers and does not reflect the variation among all values.
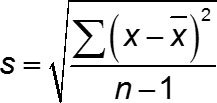
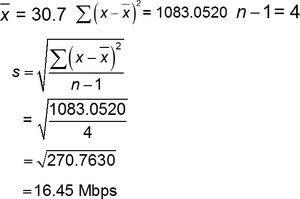
Standard Deviation: Measures how much data values deviate from the mean. It is denoted by s for samples and σ for populations. Larger values indicate greater variation.
Variance: The square of the standard deviation. It is denoted by s² for samples and σ² for populations.
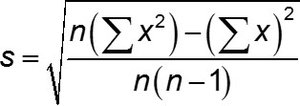
Formula for sample standard deviation:
Shortcut formula for sample standard deviation:
Example: Calculating standard deviation for Verizon data speeds.
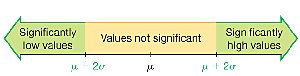
Range Rule of Thumb: Most values lie within 2 standard deviations of the mean. Significantly low values are or lower; significantly high values are or higher.
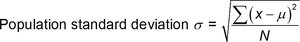
Formula for population standard deviation:
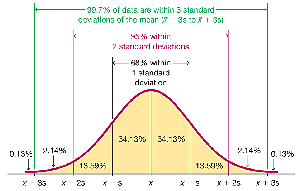
Empirical Rule: For bell-shaped distributions:
68% of values within 1 standard deviation
95% within 2 standard deviations
99.7% within 3 standard deviations
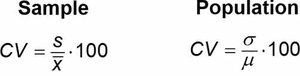
Coefficient of Variation (CV): Describes the standard deviation relative to the mean, expressed as a percentage.
Additional info: The sample standard deviation is a biased estimator of the population standard deviation, while the sample variance is an unbiased estimator of the population variance.
Measures of Relative Standing and Boxplots
Measures of relative standing indicate the position of a data value relative to others in the data set. Common measures include z scores, percentiles, quartiles, and the 5-number summary. Boxplots visually represent these statistics.
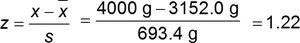
z Score: Indicates how many standard deviations a value is from the mean. Calculated as for samples or for populations. Values with z ≤ −2 or z ≥ 2 are considered significant.
Percentiles: Divide data into 100 groups, each containing about 1% of the values.
Quartiles: Divide data into four groups, each containing about 25% of the values. Q1 is the first quartile, Q2 is the median, and Q3 is the third quartile.
5-Number Summary: Consists of the minimum, Q1, median (Q2), Q3, and maximum values.
Boxplot: A graphical representation of the 5-number summary, showing the spread and skewness of the data.
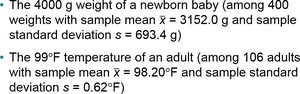
Example: Comparing a baby's weight and adult body temperature using z scores.
Additional info: Modified boxplots use special symbols to identify outliers, and the solid horizontal line extends only to the minimum and maximum values that are not outliers.
Summary Table: Measures of Center and Variation
Measure | Definition | Formula | Resistant? |
|---|---|---|---|
Mean | Sum of values divided by number of values | No | |
Median | Middle value in sorted data | N/A | Yes |
Mode | Most frequent value(s) | N/A | Yes |
Midrange | Midpoint between max and min | No | |
Range | Difference between max and min | No | |
Standard Deviation | Spread from mean | No | |
Variance | Square of standard deviation | No |
