 Back
BackL14 Chi-Square Tests, Risk, and Association in Categorical Data
Study Guide - Smart Notes
 Tailored notes based on your materials, expanded with key definitions, examples, and context.
Chi-Square Tests & Goodness of Fit
Contingency Tables and Categorical Data
Contingency tables, also known as two-way frequency tables, are used to summarize the relationship between two categorical variables. Each cell in the table represents the frequency of observations for a specific combination of categories.
Contingency Table: A matrix that displays the frequency distribution of variables.
Categorical Variables: Variables that take on a limited, fixed number of possible values, representing categories or groups.
Example: Analysis of credit defaults by previous late payment status.
Example Table: Credit Defaults
Default | Yes | No | Total |
|---|---|---|---|
Previous late payment: Yes | 347 | 486 | 833 |
Previous late payment: No | 655 | 13510 | 14165 |
Total | 1002 | 13996 | 14998 |
Interpretation: The table allows calculation of risk and comparison between groups.
Relative Risk and Absolute Risk
Risk measures are used to quantify the likelihood of an event occurring in different groups. Absolute risk is the probability of an event in a group, while relative risk compares the risk between two groups.
Absolute Risk: The probability of an event occurring in a group.
Relative Risk: The ratio of the probability of an event in one group to the probability in another group.
Formula for Absolute Risk:
Formula for Relative Risk:
Example: If 41.7% of those with previous late payment default, and 4.6% of those without default, the relative risk is .
Context: Relative risk must be interpreted alongside absolute risk, especially when the event is rare.
Chi-Square Test of Association
The chi-square test is used to determine if there is an association between two categorical variables. It compares observed frequencies in a contingency table to expected frequencies under the assumption of independence.
Null Hypothesis (H0): No association between the variables (they are independent).
Alternative Hypothesis (Ha): There is an association between the variables.
Test Statistic: The chi-square statistic is calculated as:
O: Observed frequency
E: Expected frequency
Expected Frequency Formula:
Example: Tennis Injury and Warm-Up
Testing association between injury and warm-up exercise among tennis players.
Observed frequencies:
Warm-up Exercise: Yes | Warm-up Exercise: No | |
|---|---|---|
Injury: Yes | 12 | 21 |
Injury: No | 33 | 14 |
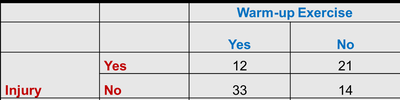
Expected frequencies are calculated for each cell.
Chi-square statistic is computed and compared to the critical value.
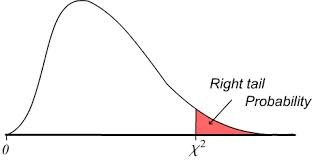
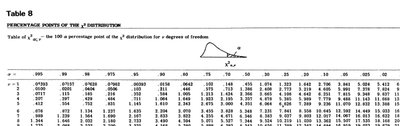
Critical Values and Degrees of Freedom
The critical value for the chi-square test is determined by the degrees of freedom and the significance level (commonly 5%). Degrees of freedom are calculated as:
r: Number of rows
c: Number of columns
Compare the calculated chi-square statistic to the critical value from the chi-square table. If the statistic exceeds the critical value, reject the null hypothesis.
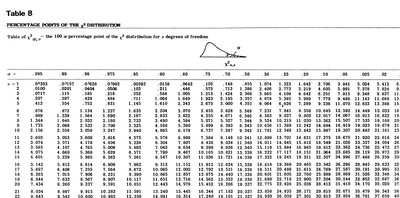
Chi-Square Table Example
Application: Trade Union Membership and Age
Testing association between age group and trade union membership.
Age | Trade Union Membership: Yes | Trade Union Membership: No | Total |
|---|---|---|---|
18 – 29 | 12 | 24 | 36 |
30 – 39 | 24 | 15 | 39 |
40+ | 40 | 10 | 50 |
Total | 76 | 49 | 125 |
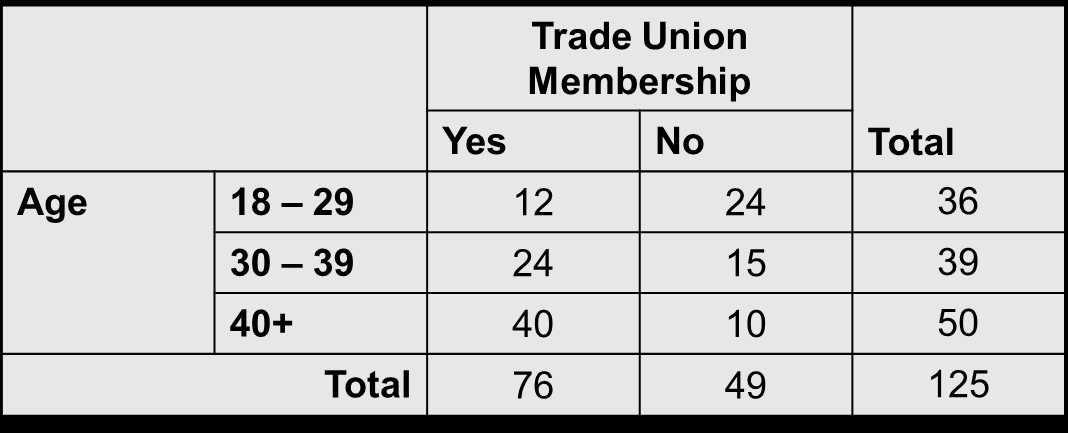
Degrees of freedom:
Critical value at 5% significance: 5.991
Chi-square statistic: 18.64 > 5.991, so reject H0
Conclusion: There is a statistically significant association between age and trade union membership.
Summary of Chi-Square Test Procedure
State null and alternative hypotheses.
Construct observed frequency table.
Calculate expected frequencies for each cell.
Compute chi-square statistic.
Determine degrees of freedom and critical value.
Compare statistic to critical value and make a decision.
Draw a conclusion about association between variables.
Formula Recap:
Critical values: Use chi-square tables with degrees of freedom and .
Example Applications: Association between injury and warm-up, age and trade union membership, and quality of materials from suppliers.
