 Back
BackConfidence Intervals & Probability Review – Step-by-Step Guidance
Study Guide - Smart Notes
 Tailored notes based on your materials, expanded with key definitions, examples, and context.
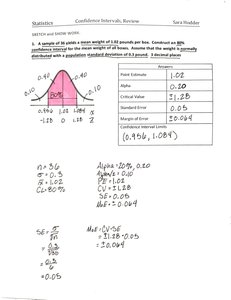
Q1. A sample of 36 yields a mean weight of 1.02 pounds per box. Construct an 80% confidence interval for the mean weight of all boxes, assuming the weight is normally distributed with a population standard deviation of 0.20 pounds. (2 decimal places)
Background
Topic: Confidence Intervals for the Mean (Normal Distribution, Known Population Standard Deviation)
This question tests your ability to construct a confidence interval for the population mean when the population standard deviation is known and the sample size is given.
Key Terms and Formulas:
Confidence Interval (CI): Range of values likely to contain the population mean.
Standard Error (SE):
Z-score for confidence level: Find for 80% confidence.
CI formula:
Step-by-Step Guidance
Identify the sample mean (), population standard deviation (), and sample size ().
Calculate the standard error:
Determine the z-score for an 80% confidence interval. For 80%, , so . Find .
Set up the confidence interval formula:
Try solving on your own before revealing the answer!
Final Answer: (0.956, 1.084)
, , so gives the interval.
This interval estimates the range in which the true mean weight of all boxes is likely to fall with 80% confidence.
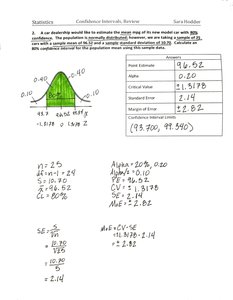
Q2. A car dealership wants to estimate the mean mpg of its new model car with 80% confidence. The population is normally distributed, and a sample of 25 cars yields a mean of 96.52 mpg and a population standard deviation of 2.82. Construct an 80% confidence interval for the population mean mpg.
Background
Topic: Confidence Intervals for the Mean (Normal Distribution, Known Population Standard Deviation)
This question tests your ability to construct a confidence interval for the mean mpg using a sample mean, known population standard deviation, and sample size.
Key Terms and Formulas:
Sample mean (), population standard deviation (), sample size ()
Standard Error:
Z-score for 80% confidence:
Confidence Interval:
Step-by-Step Guidance
Identify the sample mean (), population standard deviation (), and sample size ().
Calculate the standard error:
Determine the z-score for an 80% confidence interval ().
Set up the confidence interval formula:
Try solving on your own before revealing the answer!
Final Answer: (93.700, 99.340)
, , so gives the interval.
This interval estimates the range in which the true mean mpg is likely to fall with 80% confidence.
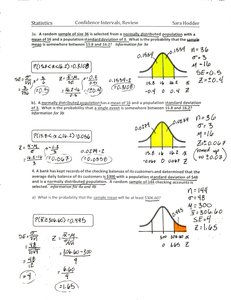
Q3. A random sample of size 36 is selected from a normally distributed population with a mean of 20.0 and a population standard deviation of 4.0. What is the probability that the sample mean will be between 19.0 and 21.0?
Background
Topic: Sampling Distribution of the Mean (Normal Distribution)
This question tests your ability to use the sampling distribution of the mean to find the probability that the sample mean falls within a specified range.
Key Terms and Formulas:
Sampling distribution mean:
Standard error:
Z-score:
Probability: Use the standard normal table to find
Step-by-Step Guidance
Calculate the standard error:
Find the z-scores for 19.0 and 21.0: ,
Use the standard normal table to find the probability between these z-scores.
Try solving on your own before revealing the answer!
Final Answer: 0.866
The probability that the sample mean is between 19.0 and 21.0 is approximately 86.6%.
Q4. What is the probability that the sample mean will be between 19.5 and 20.5?
Background
Topic: Sampling Distribution of the Mean (Normal Distribution)
This question tests your ability to calculate the probability that the sample mean falls within a narrower range using the sampling distribution.
Key Terms and Formulas:
Standard error:
Z-score:
Probability: Use the standard normal table for
Step-by-Step Guidance
Calculate the standard error as before.
Find the z-scores for 19.5 and 20.5.
Use the standard normal table to find the probability between these z-scores.
Try solving on your own before revealing the answer!
Final Answer: 0.465
The probability that the sample mean is between 19.5 and 20.5 is approximately 46.5%.
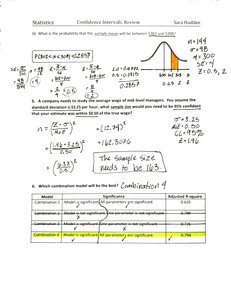
Q5. A company needs to study the average wage of mid-level managers. You assume the standard deviation is $15 per hour. What sample size would you need to be 95% confident that you are within $5 of the true wage?
Background
Topic: Sample Size Calculation for Confidence Intervals
This question tests your ability to determine the required sample size for a desired margin of error and confidence level.
Key Terms and Formulas:
Margin of error ():
Sample size formula:
95% confidence:
Step-by-Step Guidance
Identify the desired margin of error (), standard deviation (), and confidence level (95%).
Find the z-score for 95% confidence ().
Set up the sample size formula:
Try solving on your own before revealing the answer!
Final Answer: 34.6 (rounded up to 35)
You need a sample size of at least 35 to be 95% confident that your estimate is within $5 of the true wage.
