 Back
BackCorrelation and Regression: Structured Study Notes
Study Guide - Smart Notes
 Tailored notes based on your materials, expanded with key definitions, examples, and context.
Correlation and Regression
Introduction to Correlation
Correlation is a statistical measure that describes the relationship between two variables. In statistics, these variables are often represented as ordered pairs (x, y), where x is the independent (explanatory) variable and y is the dependent (response) variable. Understanding correlation helps researchers determine whether and how variables are related.
Independent Variable (x): The variable that is manipulated or used to predict another variable.
Dependent Variable (y): The variable that is measured or predicted.
Example: Predicting SAT scores based on high school GPA; GPA is x, SAT score is y.
Types of Correlation
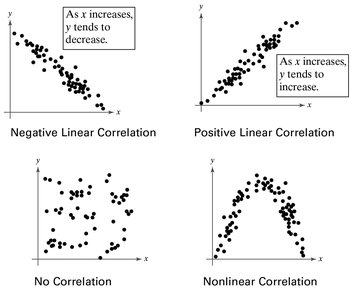
Correlation can be classified based on the direction and strength of the relationship between variables. Scatter plots are commonly used to visualize these relationships.
Positive Linear Correlation: As x increases, y tends to increase.
Negative Linear Correlation: As x increases, y tends to decrease.
No Correlation: No discernible relationship between x and y.
Nonlinear Correlation: Relationship exists but is not linear.
Example: A dentist wants to predict the number of cavities based on the type of toothbrush used. The type of toothbrush is the explanatory variable (x), and the number of cavities is the response variable (y).
Scatter Plots
A scatter plot graphs ordered pairs (x, y) as points in a coordinate plane. The independent variable x is on the horizontal axis, and the dependent variable y is on the vertical axis. Scatter plots help determine whether a linear correlation exists between two variables.
Example: Age of children (x) vs. vocabulary size (y).
Example: Height of high school girls (x) vs. IQ score (y).
Correlation Coefficient
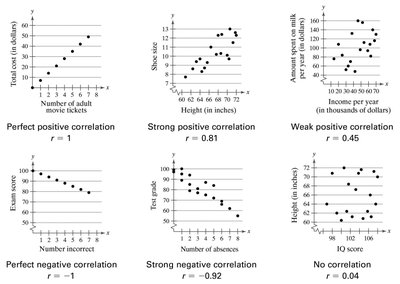
The correlation coefficient (r) measures the strength and direction of a linear relationship between two variables. The value of r ranges from -1 to 1.
r = 1: Perfect positive correlation
r = -1: Perfect negative correlation
r ≈ 0: No linear correlation
The formula for the sample correlation coefficient r is:
Where n is the number of data pairs.
Calculating the Correlation Coefficient
To calculate r, sum the values of x, y, x2, y2, and xy for all data pairs, then substitute into the formula above.
Example: For children's vocabulary data, r ≈ 0.982, indicating a strong positive linear correlation.
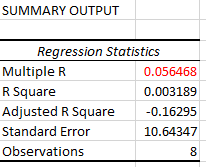
Example: For high school girls' height and IQ, r ≈ 0.056, indicating no linear correlation.
Interpreting the Correlation Coefficient
The value of r provides insight into the relationship:
Strong positive correlation: r close to 1
Strong negative correlation: r close to -1
No correlation: r close to 0
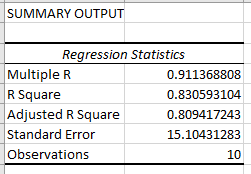
Example: Age and systolic blood pressure in men: r ≈ 0.911, strong positive correlation.
Testing the Significance of the Population Correlation Coefficient (ρ)
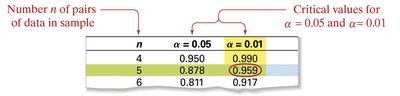
After calculating r, it is important to determine if the population correlation coefficient (ρ) is statistically significant. This is done using critical values from a table (Table 11 in Appendix B) based on the number of data pairs (n) and the chosen significance level (α).
Step 1: Determine n (number of pairs).
Step 2: Specify α (level of significance).
Step 3: Find the critical value from the table.
Step 4: If |r| > critical value, the correlation is significant.
Step 5: Interpret the result in context.
Examples of Significance Testing
Children's vocabulary data: n = 11, α = 0.05, critical value = 0.602. Since r ≈ 0.982 > 0.602, the correlation is significant.
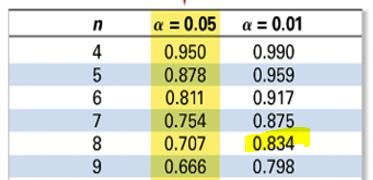
High school girls' height and IQ: n = 8, α = 0.01, critical value = 0.834. Since |r| ≈ 0.056 < 0.834, the correlation is not significant.
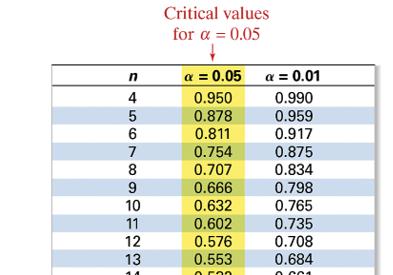
Summary Table: Correlation Coefficient Significance
The following table summarizes the critical values for different sample sizes and significance levels:
n (pairs) | α = 0.05 | α = 0.01 |
|---|---|---|
4 | 0.950 | 0.990 |
5 | 0.878 | 0.959 |
6 | 0.811 | 0.917 |
8 | 0.707 | 0.834 |
11 | 0.602 | 0.735 |
Additional info: The critical value table is used to determine whether the observed correlation coefficient is statistically significant for a given sample size and significance level.
